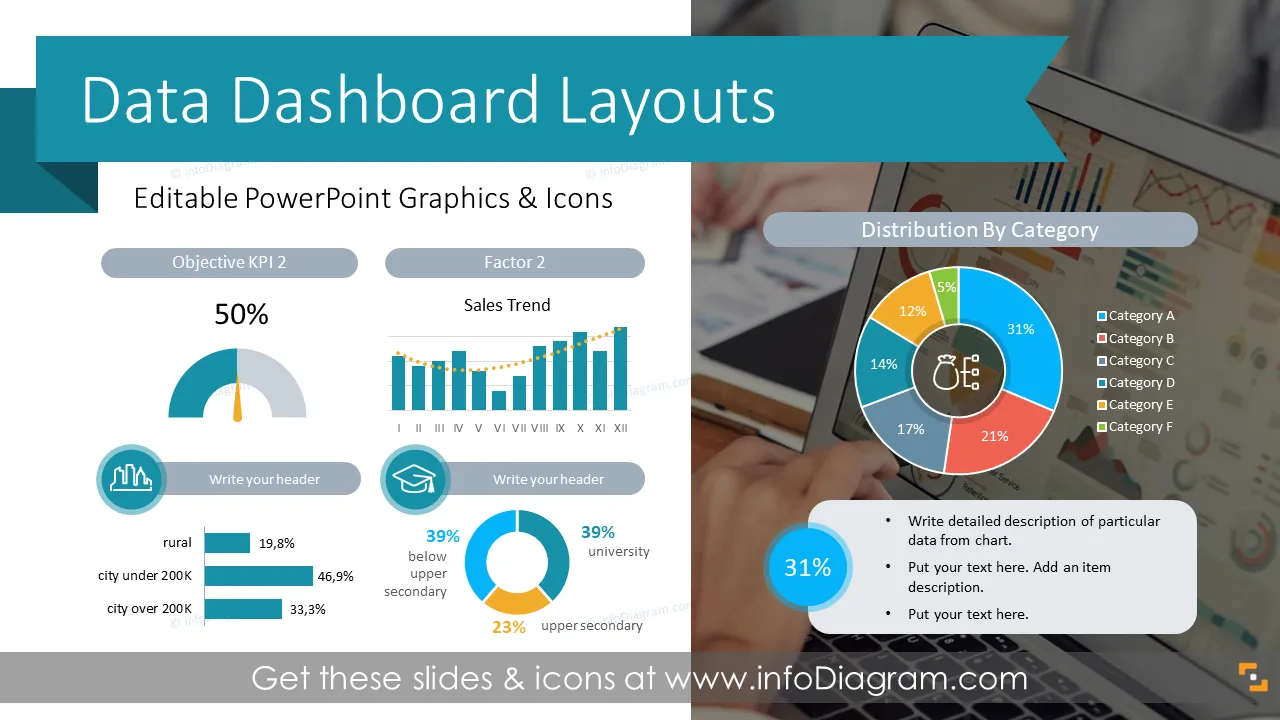
Need to present several multiple data charts and KPIs concisely on a slide? Use the clean and visual dashboard layouts to pass your message with clarity. We have designed this set of universal PowerPoint dashboard layouts with business examples, grids, and placeholders to help you make your data presentation look attractive.
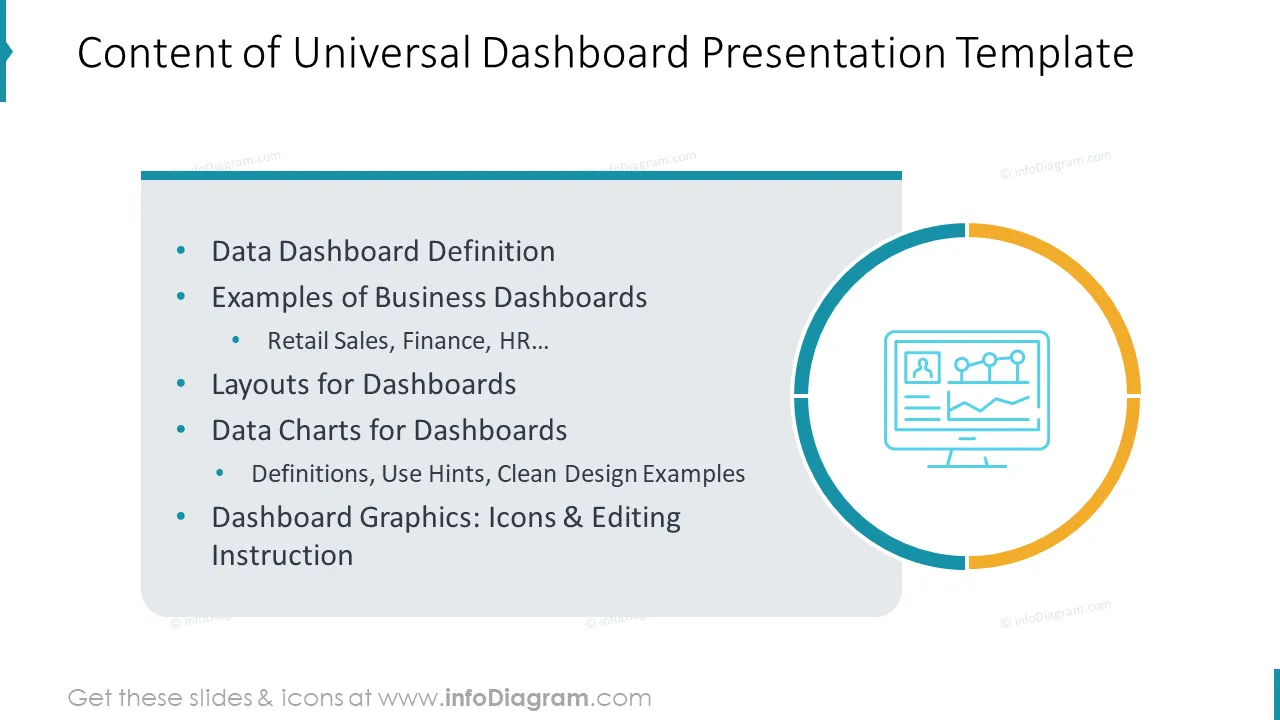
This Dashboard PPT Template contains slides with:
- 31 dashboard layouts with various data charts illustrated with icons. You can add or remove items if needed.
- 45 outline icons to illustrate business topics e.g. Finance, Distribution, Money Flow, Location and Occupation symbols, Globe, Charts and Data pictograms, People, Team Icons, and more.
- This PowerPoint slide deck is designed in a simple flat style that is modern and allows you to express the key information without clutter.
- Instruction on how to modify those diagrams using standard PowerPoint editing tools.
- Format: fully editable vector shapes (modify colors of diagrams and icons, resize without quality loss)
What is a dashboard presentation?
Presentation containing slides with multiple data charts and KPI values altogether on one screen. The purpose is to give an executive overview of a company's performance.
Dashboard, as a general term, is an information management tool that visually tracks, analyzes, and displays key performance indicators (KPI), the most important metrics, and scorecards to monitor the health of a company, department, or business-specific process.
Why and when to use PowerPoint for Dashboard presentations?
Using the MS PowerPoint tool for dashboard presentations has its benefits. The main is the flexibility of graphical beautification of charts and tables. You can easily copy Excel tables or data charts to PowerPoint and adjust their look to be consistent or add icons to make an attractive infographics dashboard.
While there are several BI reporting tools offering various dashboard outputs, they don’t offer the flexibility that PowerPoint does.
Where can you use dashboard presentations?
The presentation with data presented in the form of a dashboard can be used for example:
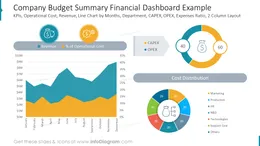
- Present Overview of Company Branch Financial Performance
- Illustrate your company key performance indicators
- Visualize snapshot of a business as a one-sheeter
- Show product sales comparison between various markets
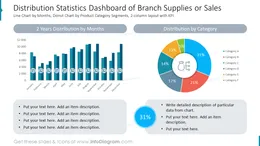
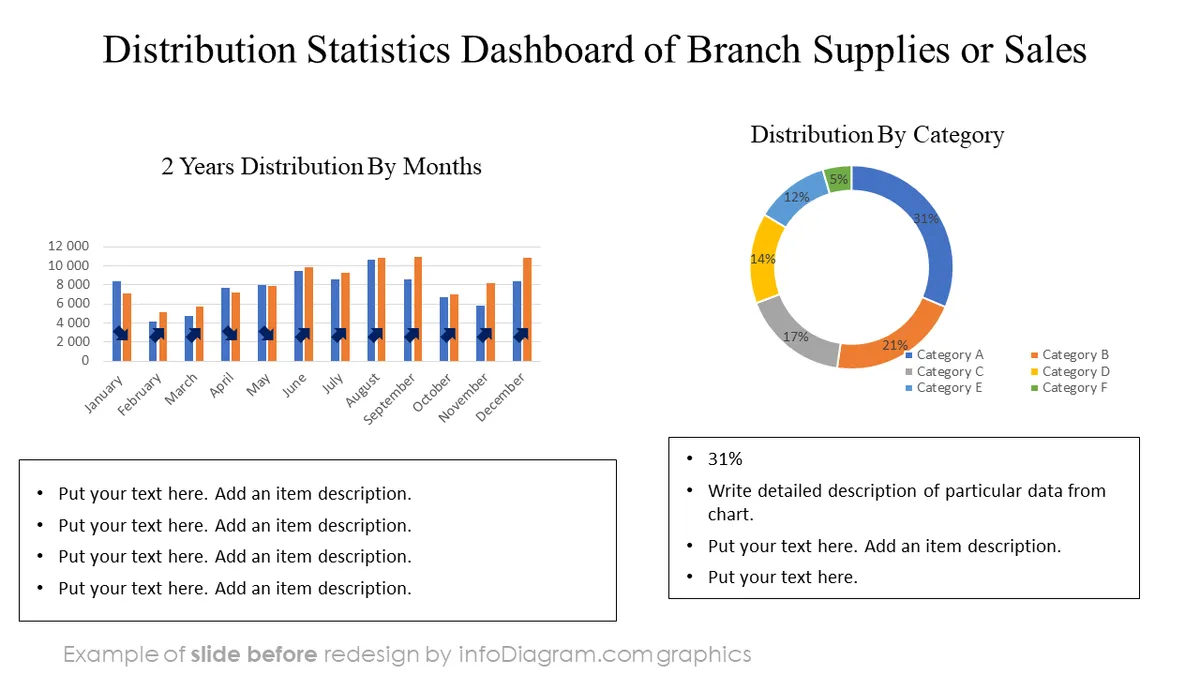
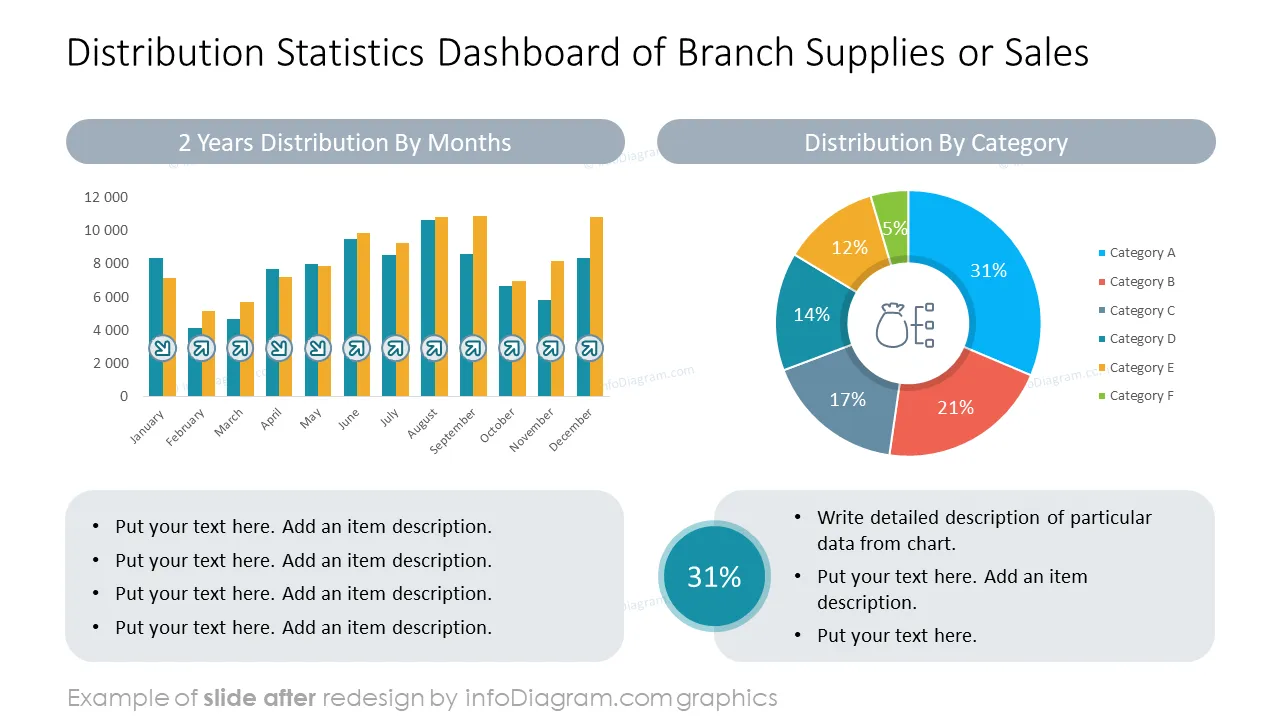
- Present Distribution Statistics Dashboard of Branch Supplies or Sales
- B2C Retail Environment and Performance Dashboard
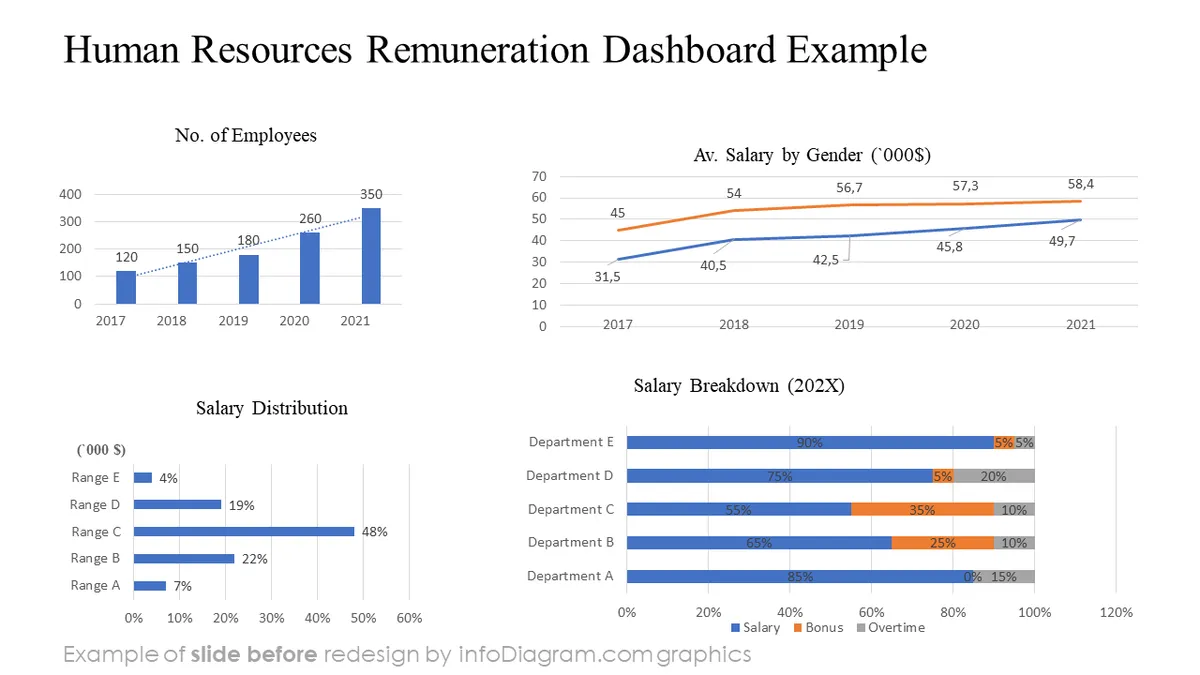
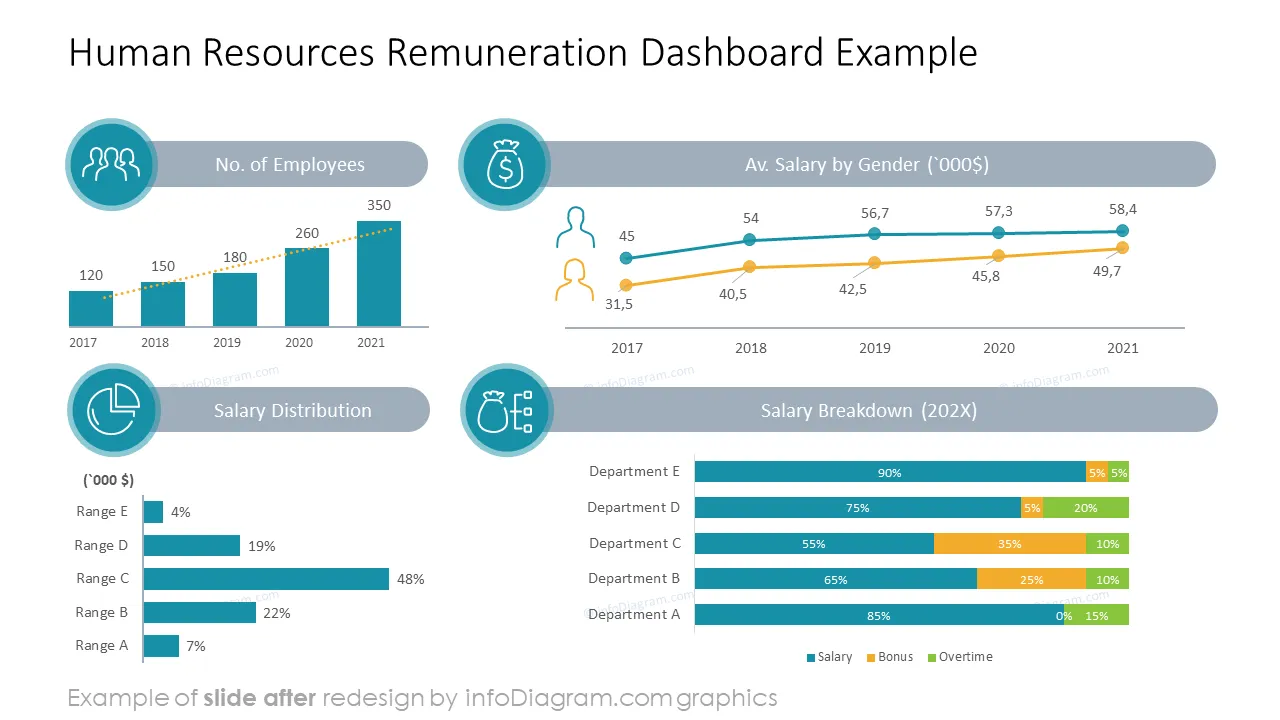
- Human Resources Remuneration Dashboard Example
- HR Dashboard Example, Employee Profile
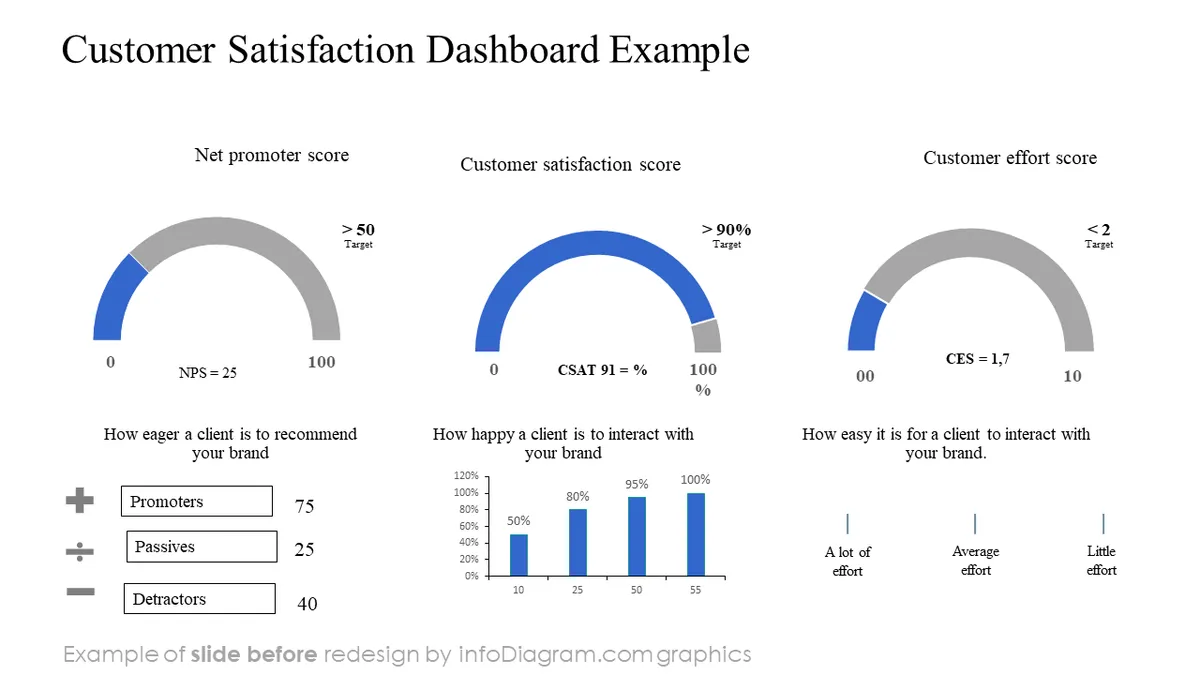
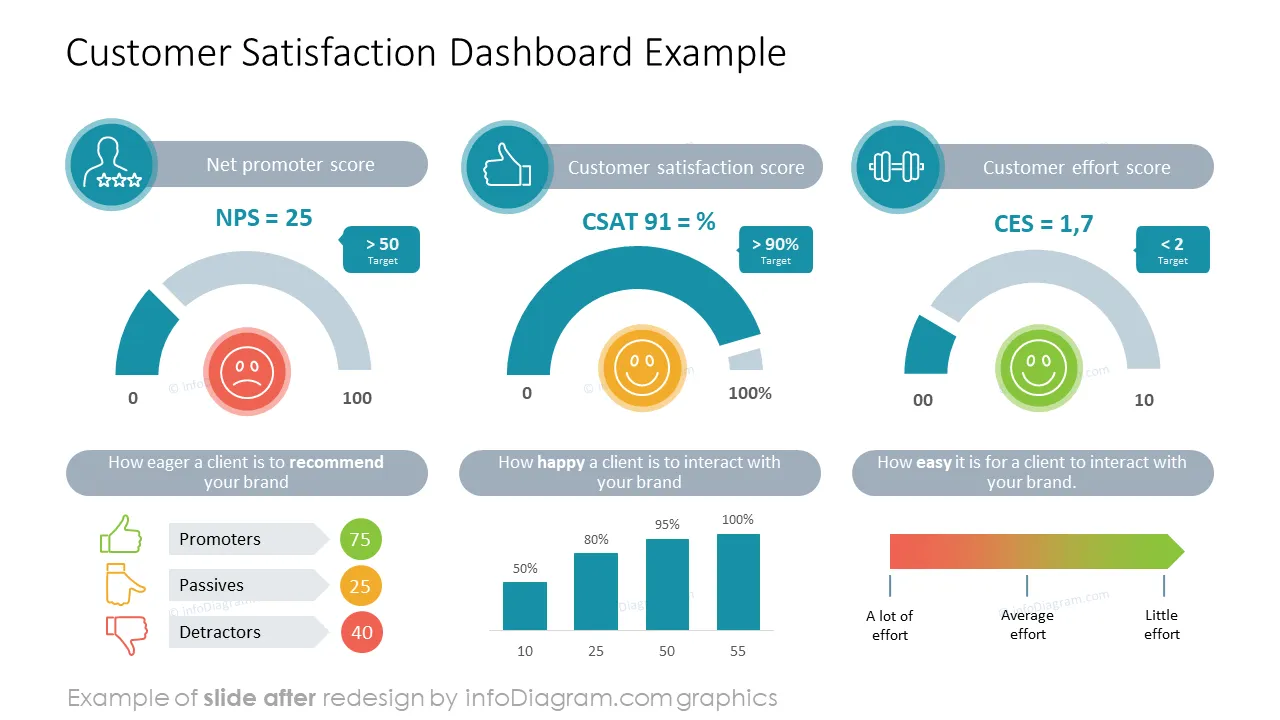
- Customer Satisfaction Dashboard
- Customer Profile
- Key Financial and Customer Performance Indicators
Try using those PowerPoint symbols to present your data visually in an elegant way.
All graphics are editable, so you can modify the colors and text. You can also extend the collection further by more PPT symbols (see Related Diagrams section).
Fully editable in PowerPoint set of vector shapes fully editable with built-in PowerPoint tools, including
- replacing icons
- changing the filling and outline color of all shapes and icons
- modifying shapes and sizes, rotating, flipping the objects, moving shapes behind or on top of texts or charts
Authors
- Design by infoDiagram's designer.
Contact: here
Further resources
To deepen your understanding and skills, we suggest exploring additional materials such as our blog and YouTube video, which are trusted sources dedicated to refining presentation decks: