Cover and narrative setup
Usage example
Deck preview
What the deck looks like in practice
This template does not have a dedicated before/after case study, so we show the strongest slides from the actual deck instead.
Cover and narrative setup
Core structure and talking points
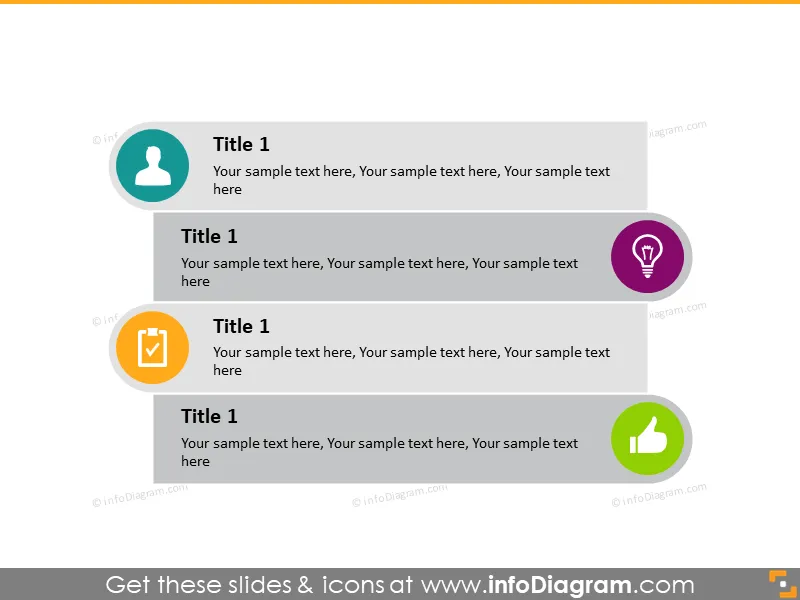
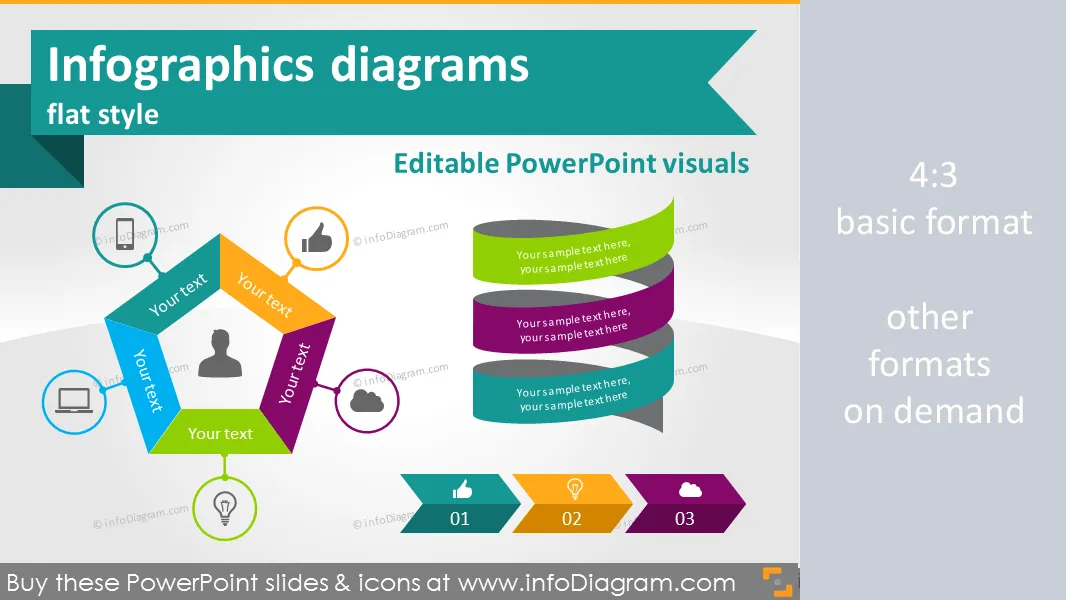
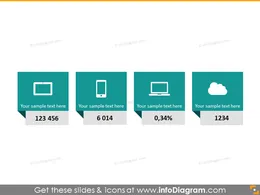
Polished visual slide from the deck
Description
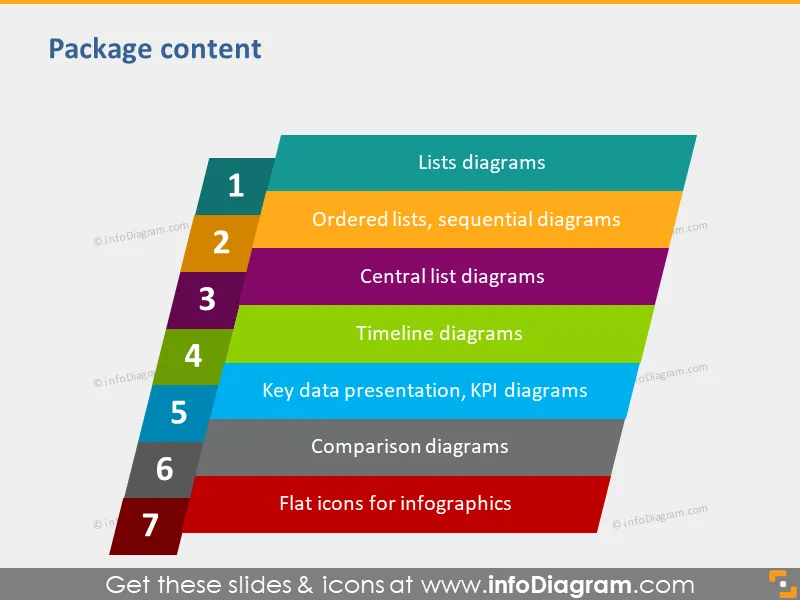
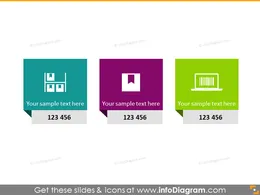
Set of diagrams for infographics made in Powerpoint
- Lists diagrams
- Ordered lists, sequence diagrams
- Central list diagrams
- Timeline diagrams
- Key data presentation, KPI diagrams
- Comparison diagrams
- set of flat icon symbols for infographics: man, computer, document, thumbs up
- fully editable style, size and colors
Content:
Diagrams and symbols for creating own infographics in Powerpoint.
Fully editable in PowerPoint set of vector shapes fully editable by using built-in PowerPoint tools, including
- changing color of the icon filling and its outline
- adding shadows
- changing shape and size, rotating, flipping the object
- putting shapes behind or on top of text
See editing demonstration in our HowTo Videos.
Authors
- Design: Izabela Zvirinska, Contact via infoDiagram.com
Slides included in this PowerPoint Presentation:
- infographics powerpoint diagram graphics agenda content
- flowchart text list points infographics diagram powerpoint
- horizontal stripes 5 points man cloud phone infographics ppt
- 4 square data presentation mobile icon infographics ppt
- 3 rectangle infographics diagram packaging scm icon ppt
- 3 central items flat infographics numbers ppt
- vertical stripe 2 items with title powerpoint
- 4 points infographics powerpoint template graphics
- hexagon shape infographics pptx icon
- 5 polygon color chart PowerPoint
- 3 items bulletpoint diagram infographics powerpoint
- windows 8 tile presentation hiqh quality icon ppt
- flat banner retro stripe title slide template infographics ppt
- diagonal list numbered items powerpoint infographics temp
- multicolor curve index schema powerpoint icons
- circle infographics template numbered 5 item list ppt
- flat rounded 3d ribbon infographics shape powerpoint diagram
- 6 steps arc circle arrows mobile slide infographics ppt
- ordered item list bullet points infographics ppt template
- 6 order levels list powerpoint schema slide
- colorful slanted trapeze description flowchart diagram
- skewed items index list powerpoint infographics design
- parallel item list powerpoint slide design icons
- connected items list pptx presentation symbols
- flowchart infographics circle items ppt
- chain flow chart infographics ppt
- multicolor chain flow scheme powerpoint diagram
- 3 circle color infographics professional icons ppt
- 5 central rectangular diagrams list infographics
- 5 multicolored piece together puzzles symbols slide
- 3 connected elements list powerpoint slide
- circle plan diagram professional presentation icons
- 4 circuits plan list powerpoint pictogram clip arts
- 6 colorful rings diagram powerpoint design presentation
- connected circles schema high quality powerpoint icons
- colorful pentagon round icons graphic design
- multicolor circle detailed diagram slide
- colored horizontal timeline diagram infographics
- monthly horizontal timeline plan powerpoint clipart
- directional monthly timeline professional icons ppt
- arrow timeline axis diagram powerpoint slides
- 4 multicolor circles key points powerpoint clip arts
- color full fill circls key data points infographics ppt
- bar chart infographics template flat powepoint
- pie chart infographics template flat powepoint
- range chart infographics template flat powepoint
- double circle chart infographics template flat
- statistics people data infographics chart powerpoint icon
- female symbol data chart infographics template ppt slide
- vertical comparison diagram infographics template
- comparison diagram schema umbrella cover powerpoint slide
Reviews
Seus gráficos dão um toque agradável às minhas apresentações e eu os usei recentemente para uma das minhas reuniões gerais. Sua caixa de ferramentas adiciona profissionalismo aos meus slides. Em vez de usar clipart padrão.
Claude Jones, Diretor de Engenharia, @Walmartlabs, USA
Eu precisava de um novo visual para alguns dos meus slides. Tentei encontrar uma maneira de criar um efeito de pincel, para sublinhar, acentuar, adicionar alguma cor e os marcadores manuscritos foram exatamente o que eu procurava. Muito fácil de usar, fácil de redimensionar, mudar a cor. Foi uma solução acessível e perfeita e estou feliz em recomendá-la.
Anonymous, US
A aparência nítida e limpa dos gráficos, e o fato de me permitir editar e alterar facilmente as cores para combinar com o modelo, foi o principal motivo para comprá-los.
Brandie Jenkins, Desenvolvedor de E-learning, USA
How to Edit
How to edit text & colors

How to expand / shorten diagram

How to Replace Icons in infoDiagram PPT

You may also need