Your graphics add a nice touch to my presentations and I recently used them for one of my all-hands meetings. Your toolbox adds professionalism to my slides. Instead of using standard clipart.
Claude Jones, Director of Engineer, @Walmartlabs, USA

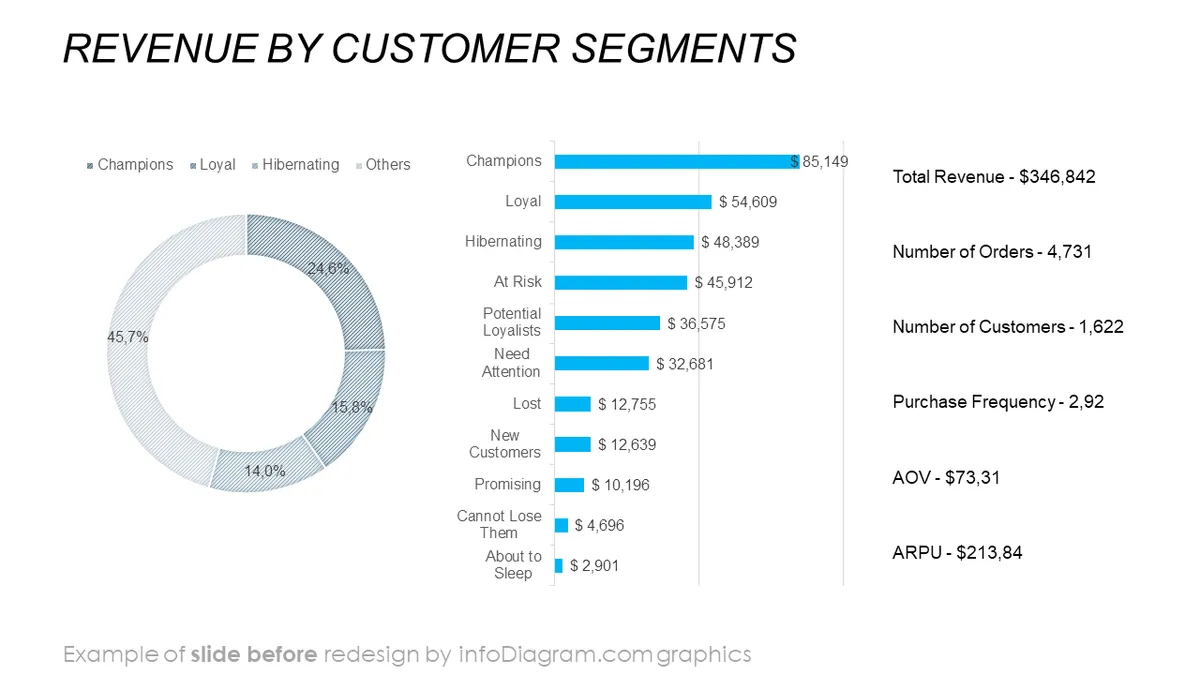
Before and after
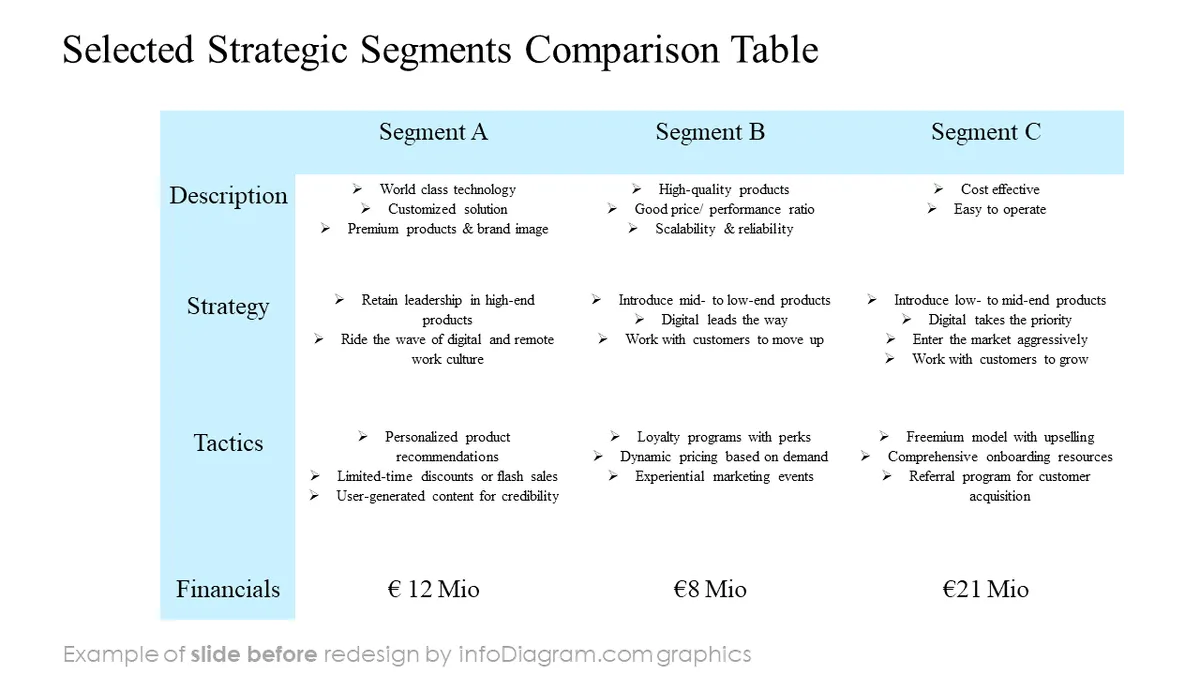
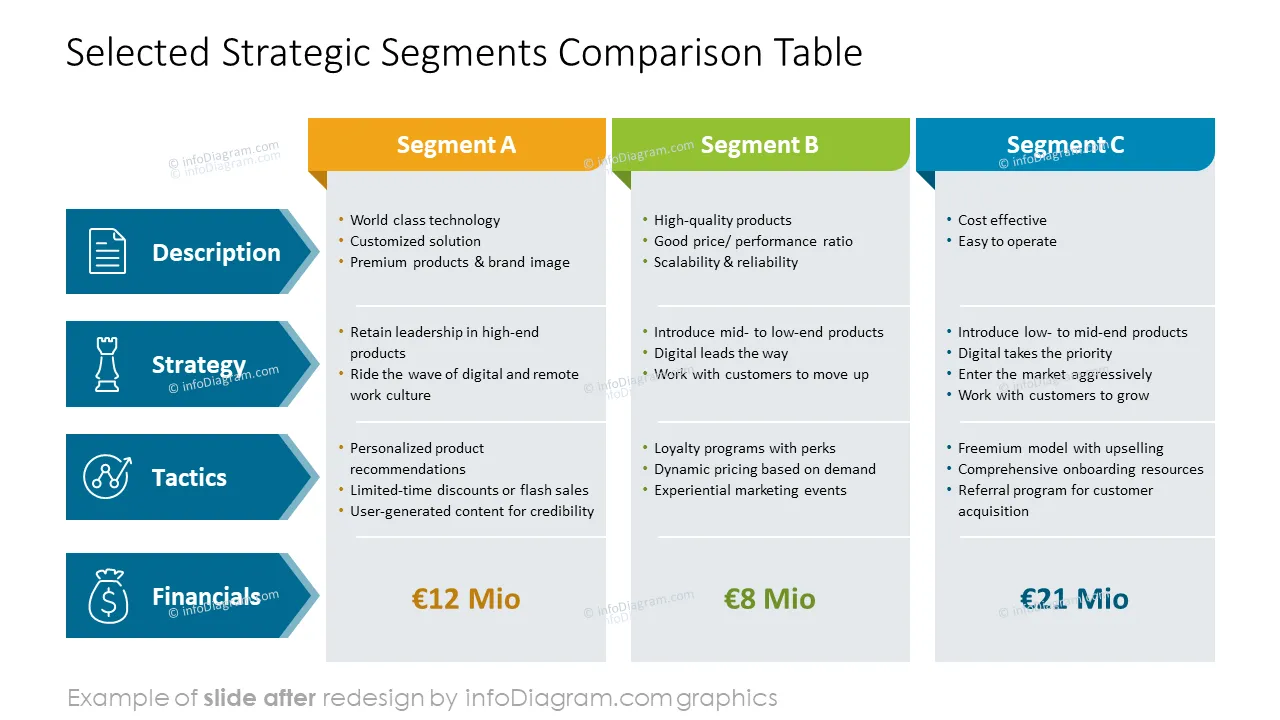
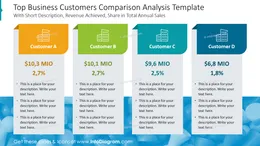
Do you need to address the diverse needs of your B2B customers and present your tailored strategies and product or service offerings based on the segmentation models? Use our ready-content ppt to convey your thoughts in an attractive and eye-catching format.
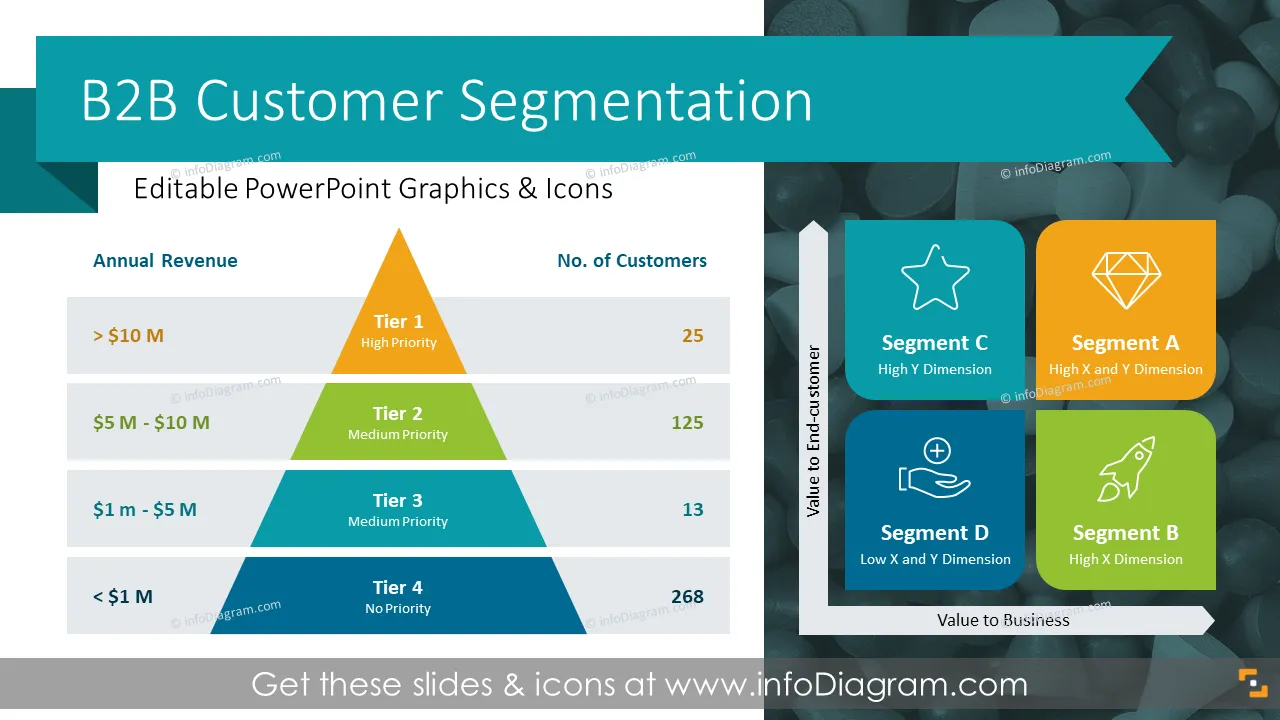
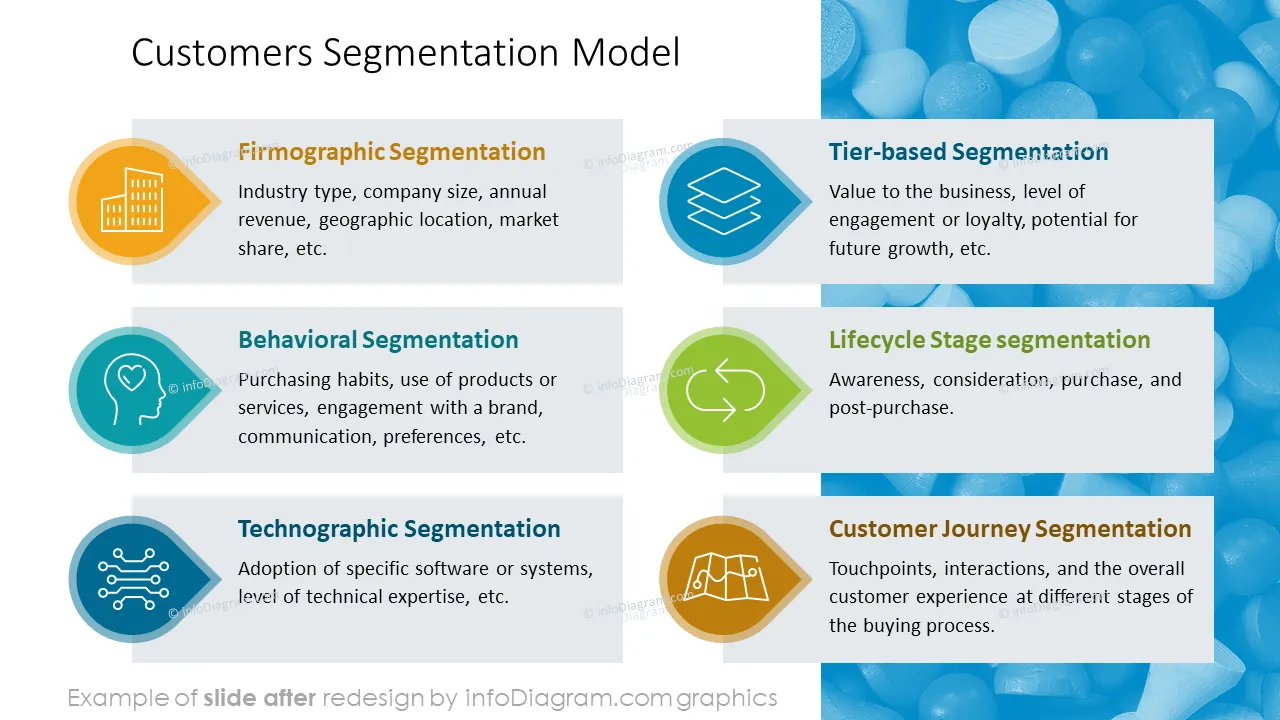
This PowerPoint slide deck is designed in an elegant flat style with colorful vector illustrations and outline icons. All graphic shapes can be recolored and resized without quality loss.
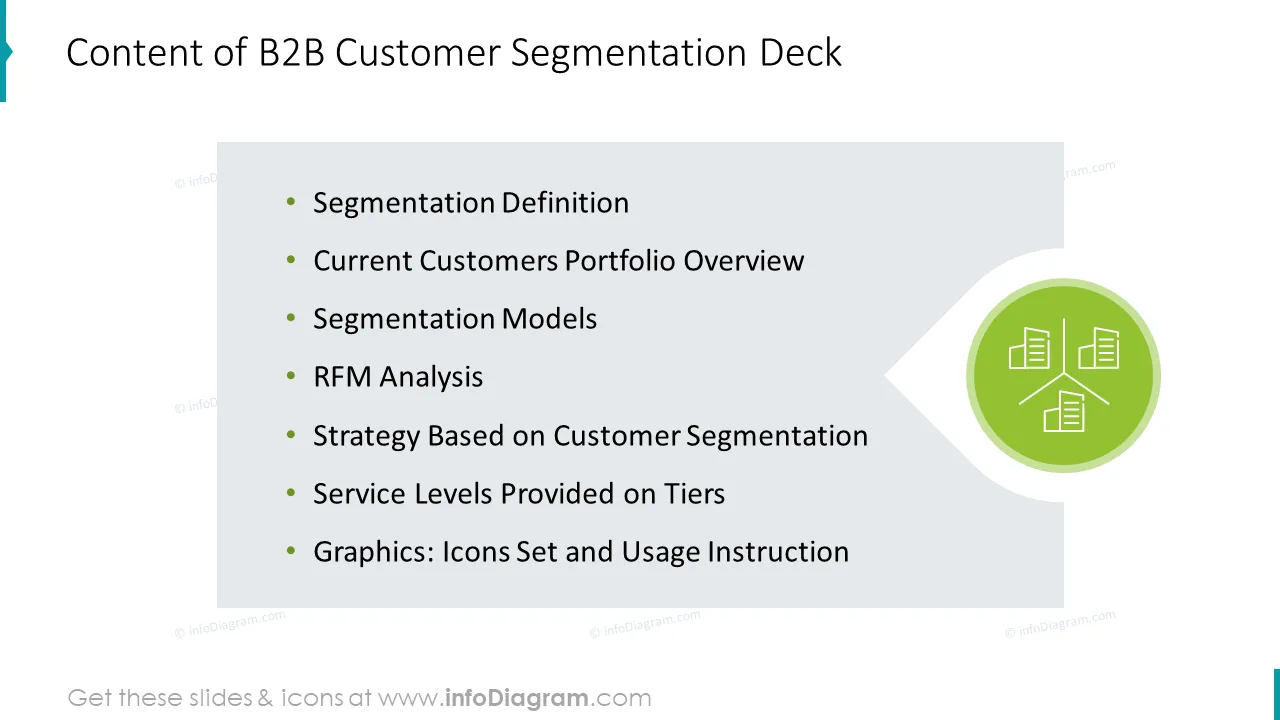
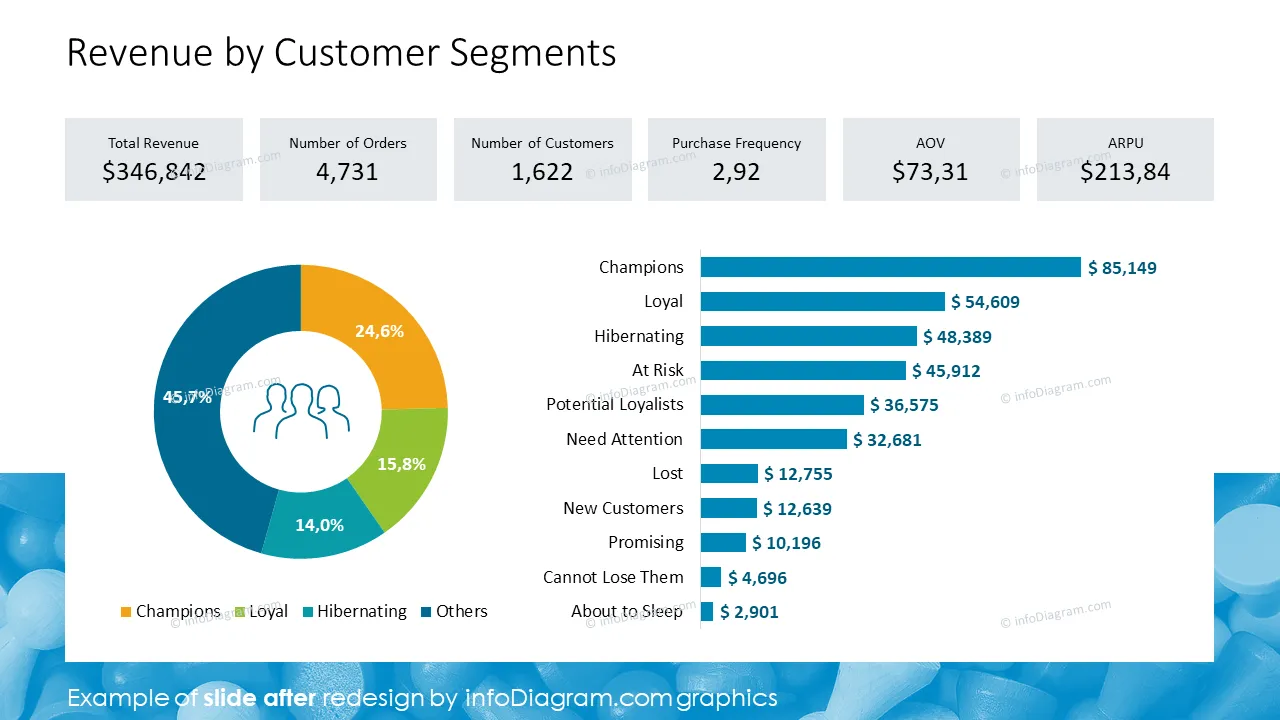
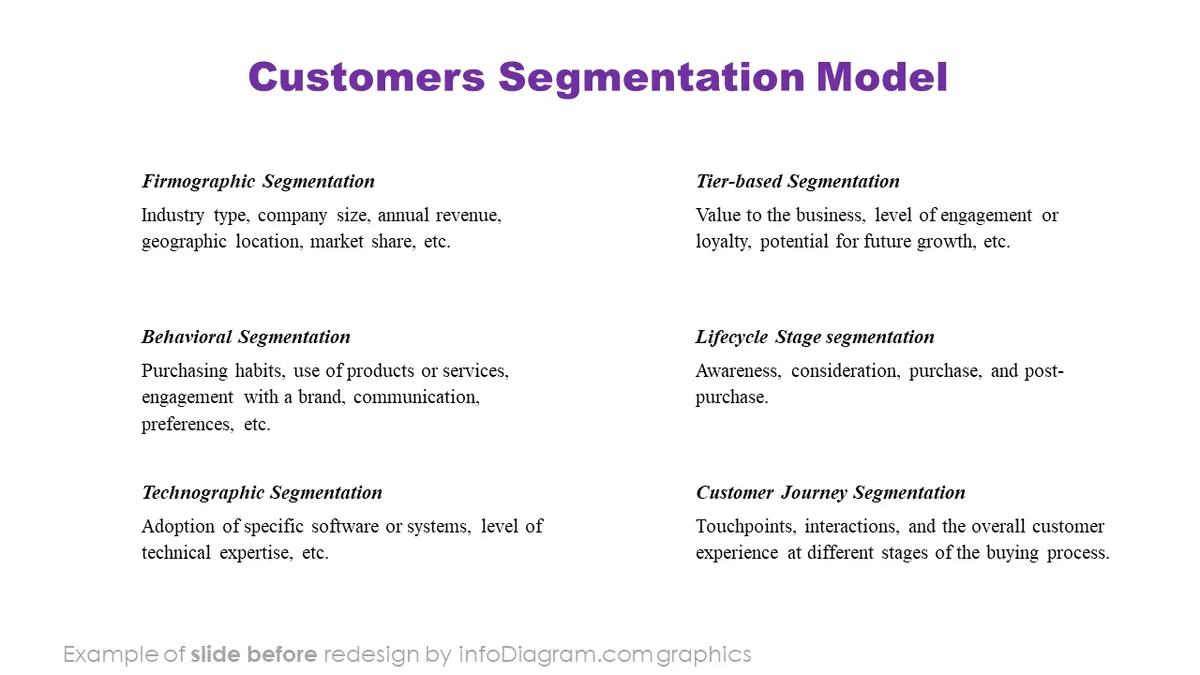
Segmenting B2B (business-to-business) customers involves categorizing businesses or organizations into groups based on specific characteristics or criteria. Customer segmentation is a strategic approach that allows companies to tailor their marketing efforts, communication strategies, and product/service offerings better to meet the specific needs of different customer segments.
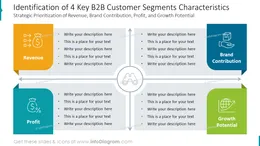
Effective customer segmentation enables more personalized and targeted service to your customers, ultimately enhancing their satisfaction and increasing the likelihood of business success. The choice of a specific B2B customer segmentation model depends on the industry, business goals, available data, and the nature of customer relationships. A combination of multiple models often provides a more comprehensive understanding of the customer base.
Select the segmentation method appropriate for your business from our content colors and look and feel of the charts, diagrams, and ready deck to upgrade your presentation slides. Our slides are effortless to edit. We include detailed instructions on altering the charts, diagrams, and icons' content, values, colors, and look and feel.
Using infographics in your business plan presentation will help you organize information in a good-looking and attractive format and compellingly present your plans, easy to understand by your audience.
Try using those PowerPoint graphics to present your data visually in an elegant way.
All graphics are editable to modify the size, colors, and text. Also, you can extend the collection further with more PPT symbols (see Related Diagrams section).
Try using thisset of fully editable PowerPoint vector shapes to present your data visually in an elegant way. You can easily modify all elements:
Your graphics add a nice touch to my presentations and I recently used them for one of my all-hands meetings. Your toolbox adds professionalism to my slides. Instead of using standard clipart.
Claude Jones, Director of Engineer, @Walmartlabs, USA
I needed a fresh look at some of my slides. I've tried to find a way to create a paintbrush effect, to underline, accentuate, add some color and the handwritten markers were just the things. Very easy to use, easy to size, change the color. It was an affordable, perfect solution and I'm happy to recommend it.
Anonymous, US
The crisp, clean look of the graphics, and the fact that it allowed me to easily edit and change the colors to match the template was my main reason for purchasing them.
Brandie Jenkins, E-learning Developer, USA


You may also need