Your graphics add a nice touch to my presentations and I recently used them for one of my all-hands meetings. Your toolbox adds professionalism to my slides. Instead of using standard clipart.
Claude Jones, Director of Engineer, @Walmartlabs, USA
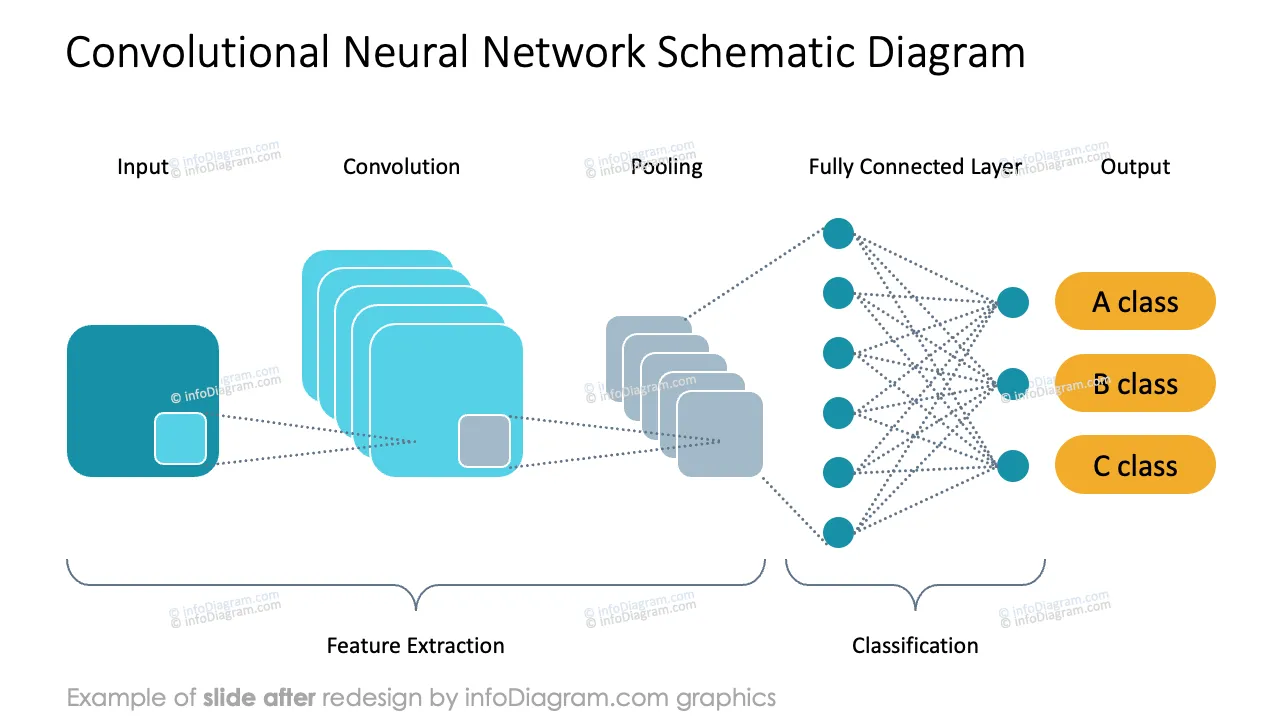
Before and after
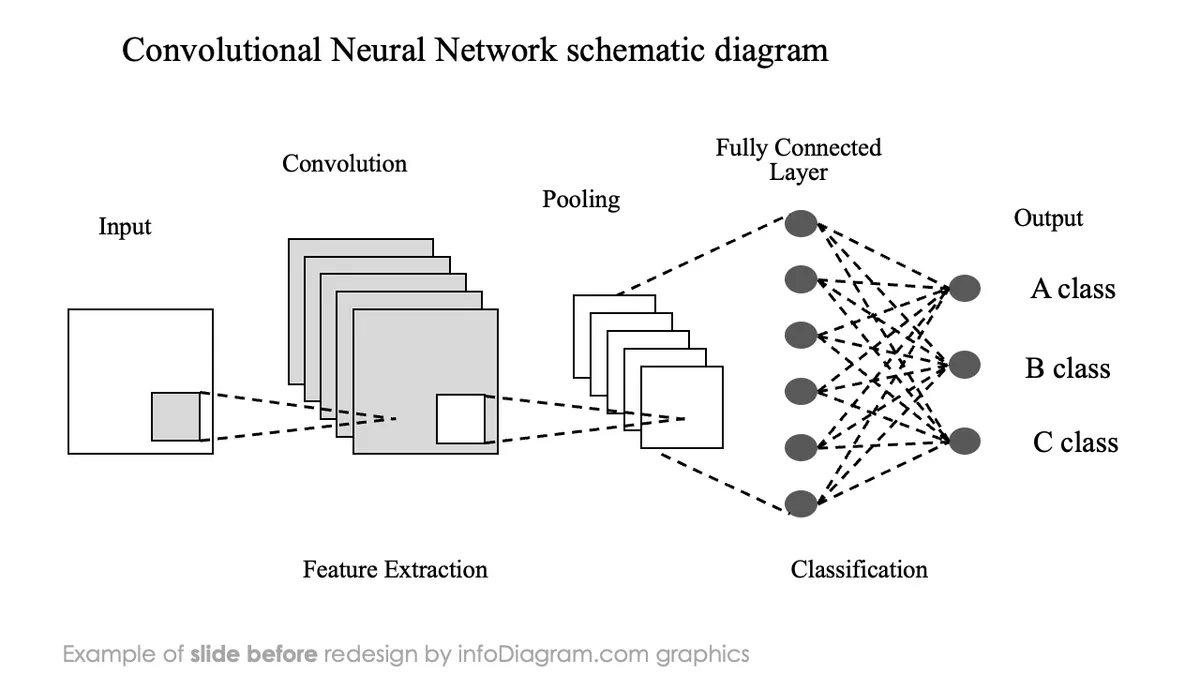
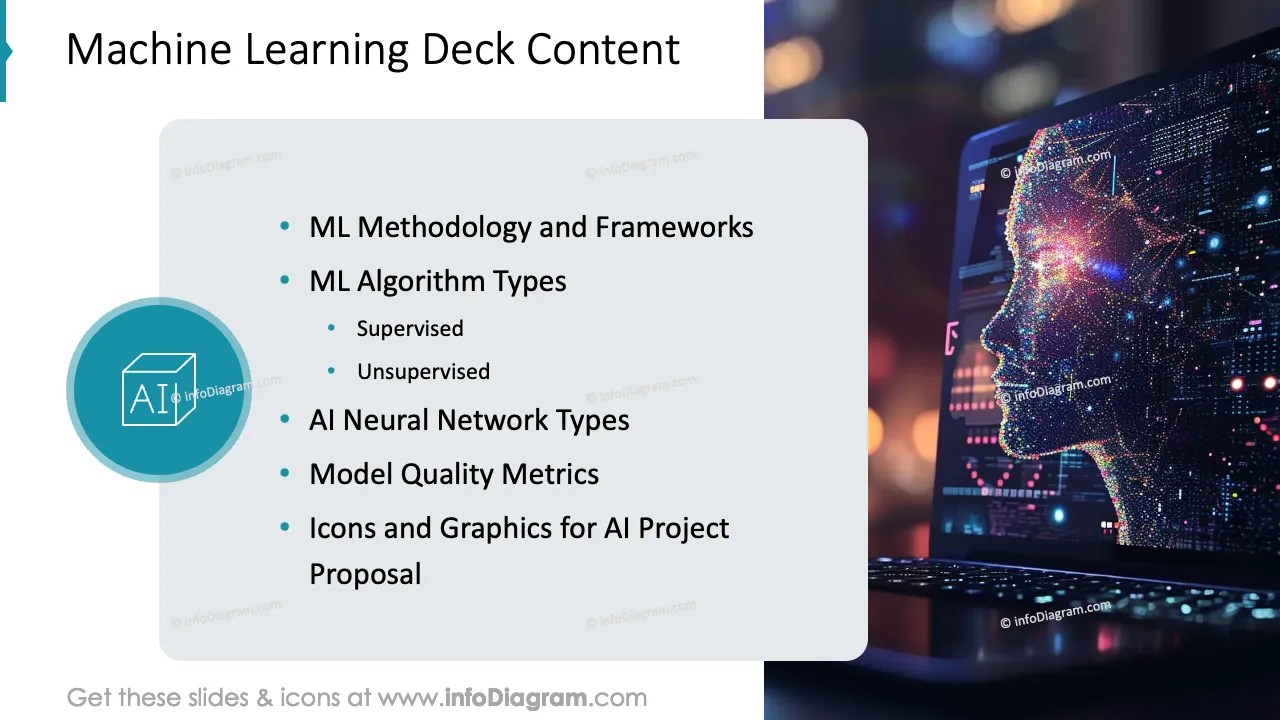
Want to present Machine Learning algorithms? Teach and explain how Neural Networks or Classification Trees work?
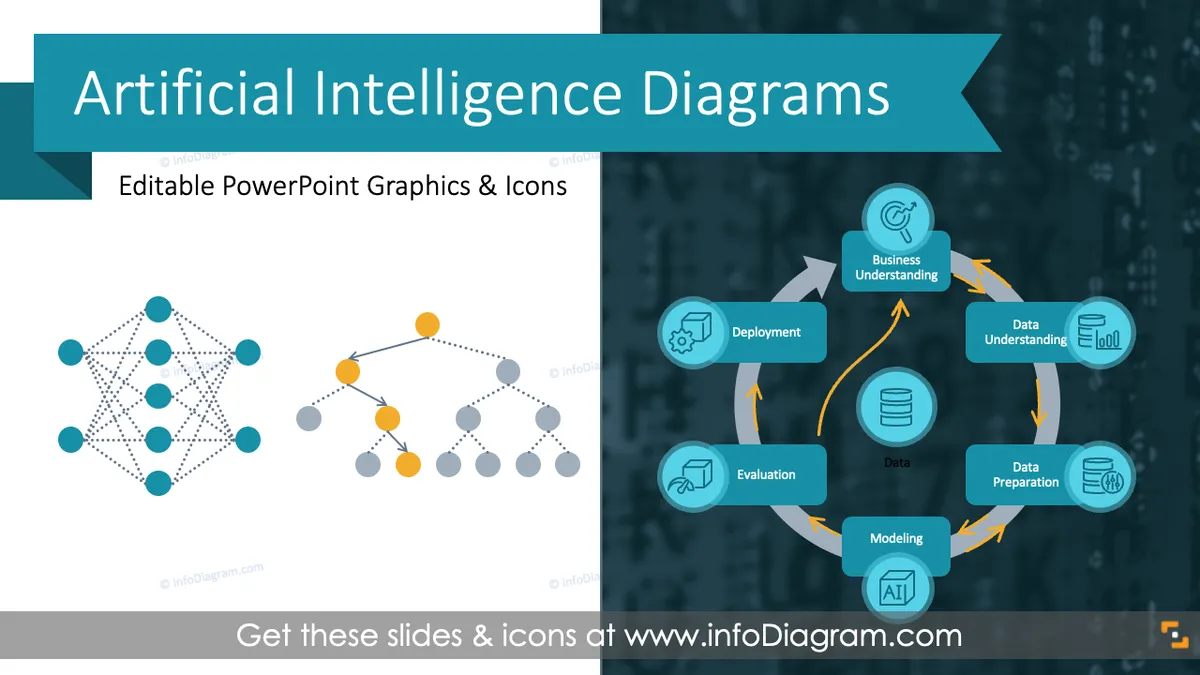
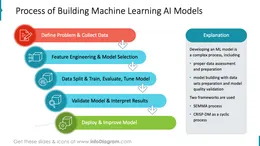
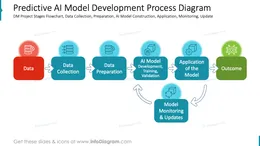
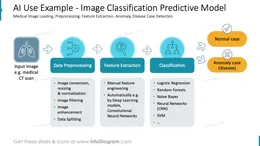
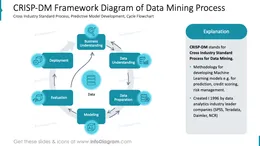
Use visual illustrations and diagrams to explain the structure and math of Predictive AI Models, the process of developing Machine Learning solutions, or the CRISP-DM framework.
We have designed a PowerPoint template with illustrations of AI methods to help you present the essence of Machine Learning in an engaging visual way.
This PowerPoint slide deck is designed in an elegant, flat style with colorful vector illustrations and outline icons. All graphic shapes can be recolored and resized without quality loss.
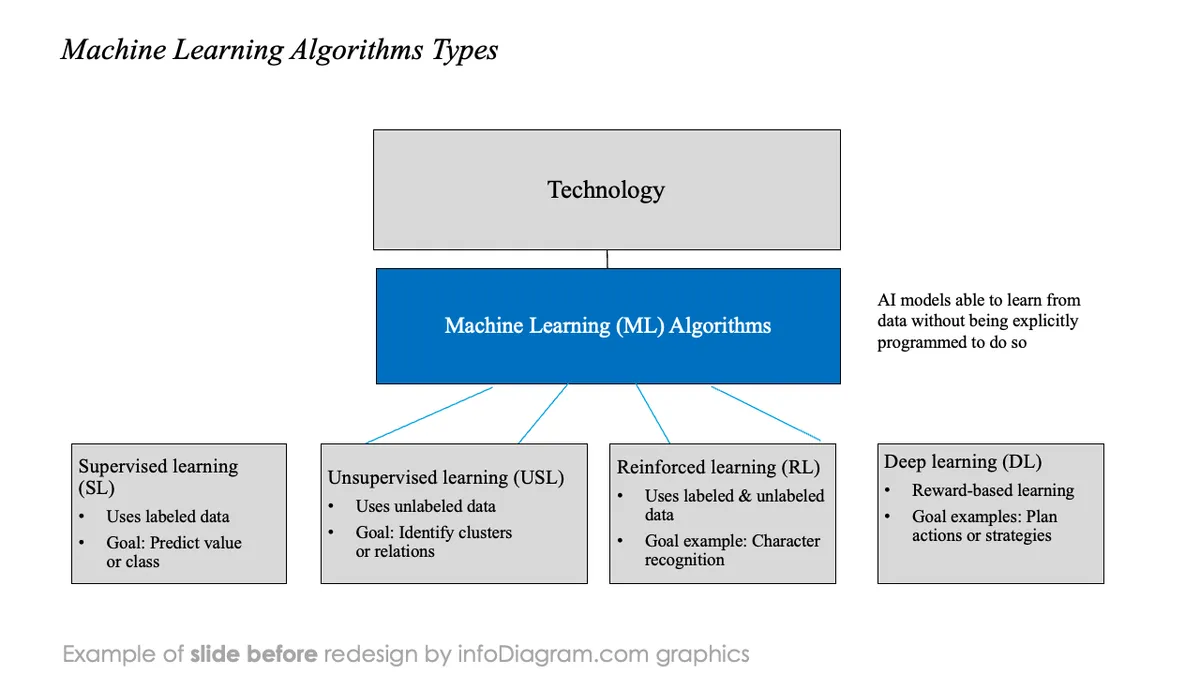
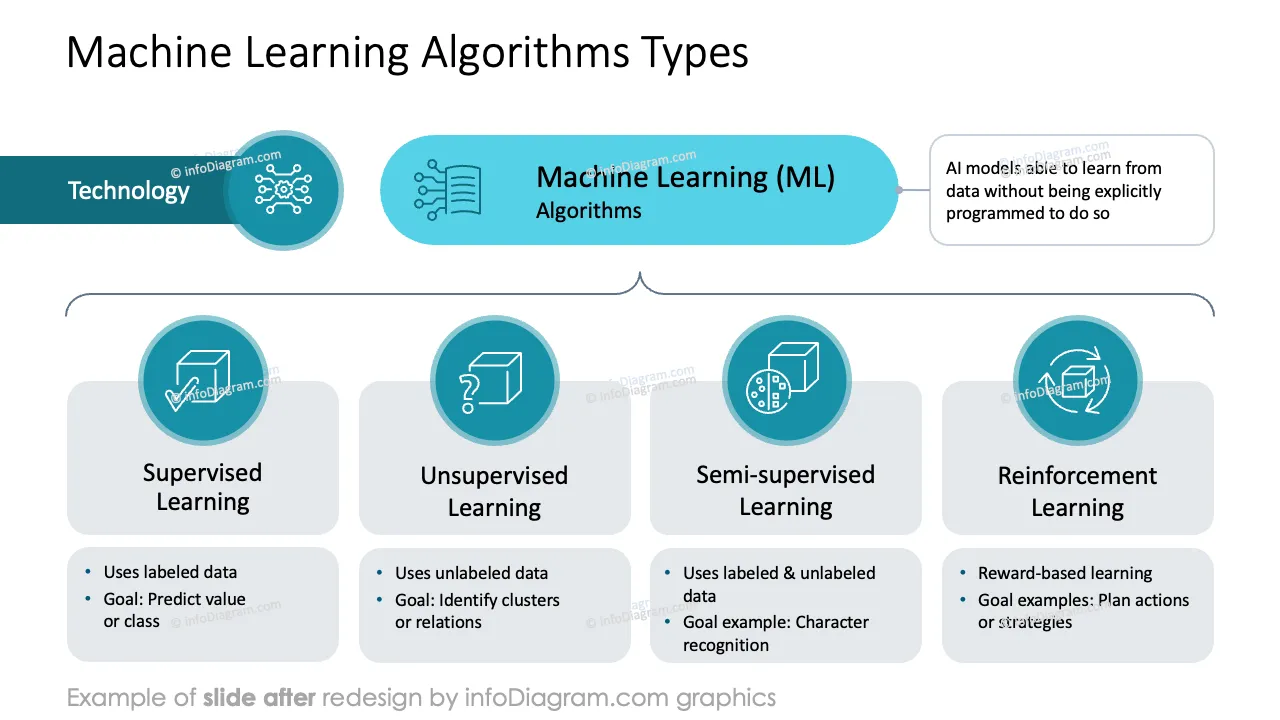
This is part of the Artificial Intelligence area, containing mathematical methods that can learn from data without being explicitly programmed to do so.
Machine Learning algorithms are based on statistical formulas and computational models that can learn to predict expected values or identify patterns in input data.
The types of Machine Learning are divided by the task or type of algorithm.
Some also add Deep Learning as a separate type of machine learning that uses deep neural networks (with multiple layers, able to identify high-level abstraction patterns from big data sets).
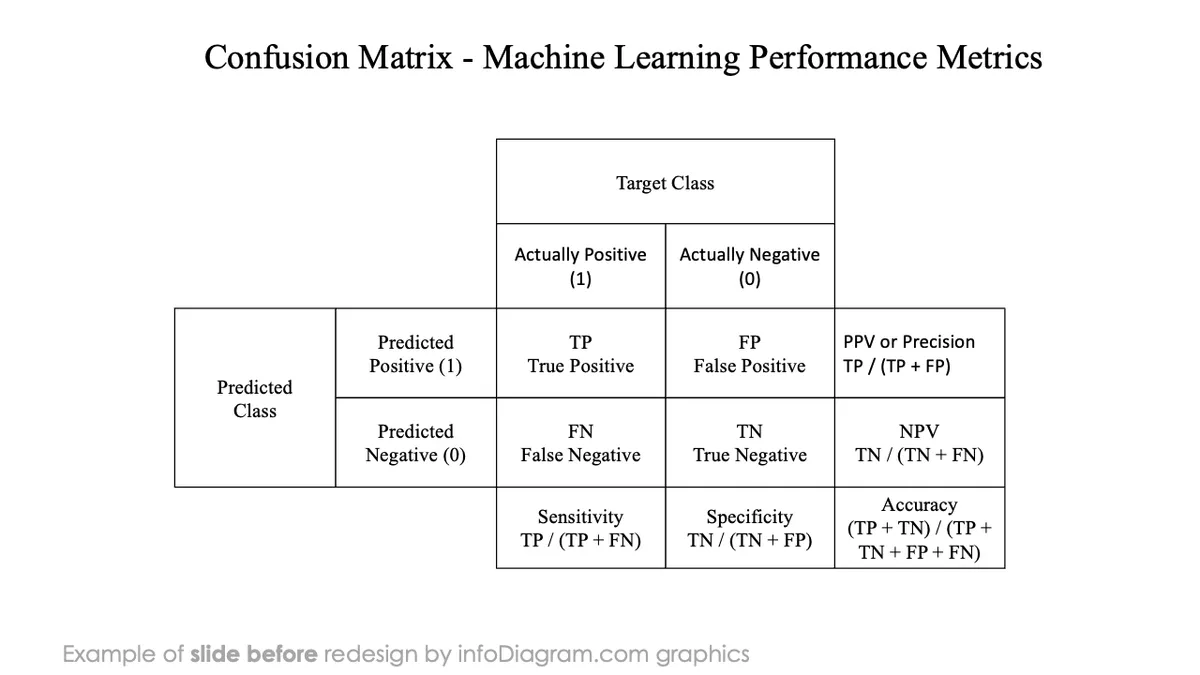
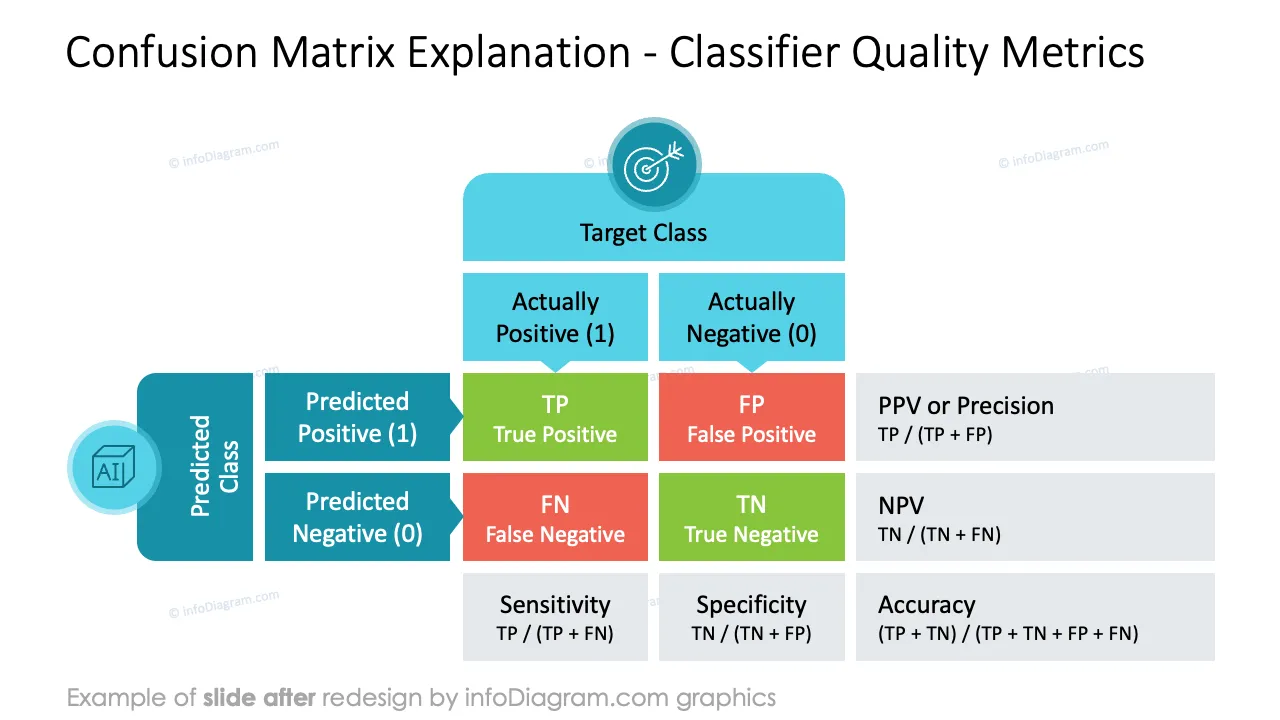
Because Machine Learning algorithms are based on complex calculation models, it is better to present them at an abstraction level that is easy to understand.
Use flowchart diagrams to explain the calculation flow of Artificial Neural Networks. Draw a structure diagram to present a decision tree or random forest algorithm.
Also, presenting mathematical formulas for Naïve Bayes or a logistic regression chart can help your audience grasp the essence of those AI models.
Whether you are a business manager or teacher explaining AI concepts, using visual aids can significantly improve the impact of your presentation. Here are some example situations where you can use our AI algorithms graphics:
Try using those PowerPoint graphics to present your data visually in an elegant way.
All graphics are editable to modify the size, colors, and text. Also, you can extend the collection further with more PPT symbols (see Related Diagrams section).
Try using thisset of fully editable PowerPoint vector shapes to present your data visually in an elegant way. You can easily modify all elements:
Your graphics add a nice touch to my presentations and I recently used them for one of my all-hands meetings. Your toolbox adds professionalism to my slides. Instead of using standard clipart.
Claude Jones, Director of Engineer, @Walmartlabs, USA
I needed a fresh look at some of my slides. I've tried to find a way to create a paintbrush effect, to underline, accentuate, add some color and the handwritten markers were just the things. Very easy to use, easy to size, change the color. It was an affordable, perfect solution and I'm happy to recommend it.
Anonymous, US
The crisp, clean look of the graphics, and the fact that it allowed me to easily edit and change the colors to match the template was my main reason for purchasing them.
Brandie Jenkins, E-learning Developer, USA


You may also need