Your graphics add a nice touch to my presentations and I recently used them for one of my all-hands meetings. Your toolbox adds professionalism to my slides. Instead of using standard clipart.
Claude Jones, Director of Engineer, @Walmartlabs, USA
Your graphics add a nice touch to my presentations and I recently used them for one of my all-hands meetings. Your toolbox adds professionalism to my slides. Instead of using standard clipart.
Claude Jones, Director of Engineer, @Walmartlabs, USA
I needed a fresh look at some of my slides. I've tried to find a way to create a paintbrush effect, to underline, accentuate, add some color and the handwritten markers were just the things. Very easy to use, easy to size, change the color. It was an affordable, perfect solution and I'm happy to recommend it.
Anonymous, US
The crisp, clean look of the graphics, and the fact that it allowed me to easily edit and change the colors to match the template was my main reason for purchasing them.
Brandie Jenkins, E-learning Developer, USA
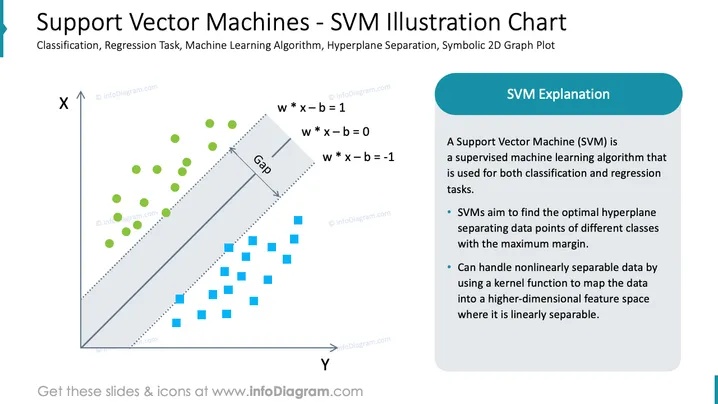
The slide is an educational graphic describing Support Vector Machines (SVMs), which are a supervised machine learning algorithm used for classification and regression tasks. This graphical representation explains that SVMs work by finding the optimal hyperplane that separates data points of different classes with the maximum margin. It showcases how SVMs can handle nonlinearly separable data by employing a kernel function to project the data into a higher-dimensional feature space where it can be linearly separated, thus ensuring effective classification.
The slide has a clean, professional design with a balance between graphical data illustration and explanatory text, facilitating easy comprehension. The color scheme is restrained, using blue and green to distinguish between classes of data points, with a grey-shaded area highlighting the margin gap.


