Your graphics add a nice touch to my presentations and I recently used them for one of my all-hands meetings. Your toolbox adds professionalism to my slides. Instead of using standard clipart.
Claude Jones, Director of Engineer, @Walmartlabs, USA
Your graphics add a nice touch to my presentations and I recently used them for one of my all-hands meetings. Your toolbox adds professionalism to my slides. Instead of using standard clipart.
Claude Jones, Director of Engineer, @Walmartlabs, USA
I needed a fresh look at some of my slides. I've tried to find a way to create a paintbrush effect, to underline, accentuate, add some color and the handwritten markers were just the things. Very easy to use, easy to size, change the color. It was an affordable, perfect solution and I'm happy to recommend it.
Anonymous, US
The crisp, clean look of the graphics, and the fact that it allowed me to easily edit and change the colors to match the template was my main reason for purchasing them.
Brandie Jenkins, E-learning Developer, USA
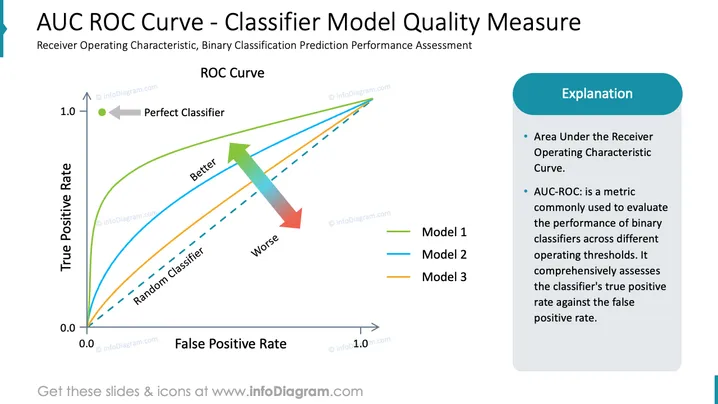
This PowerPoint slide is titled "AUC ROC Curve - Classifier Model Quality Measure" and discusses the Receiver Operating Characteristic (ROC) curve as a method for assessing the performance of binary classification models. The ROC curve is a graphical plot that illustrates the diagnostic ability of a binary classifier system as its discrimination threshold is varied. The title refers to the Area Under the Curve (AUC) of the ROC, which is a measure of how well a parameter can distinguish between two diagnostic groups (diseased/normal). A perfect classifier is indicated at the top left of the curve.
The visual composition of the slide is balanced, with the graph occupying the majority of the space and the explanation section cleanly aligned to the right. The use of colors is consistent and aids in distinguishing different pieces of information.


