An HR dashboard is a human resources management tool that visually tracks, analyses, and displays key performance indicators (KPI), metrics, and key data points to monitor the health of the HR department or specific HR processes. The HR metrics dashboard is a great way to keep track of your human resources metrics. Tracking performance data and utilizing the dashboards can help you identify which metrics are performing well and which ones need additional focus.
Our PPT dashboard templates visualize the data in a simple way to make the data analysis and distribution easier on the eye by displaying the most important aspects of the human resources performance indicators.
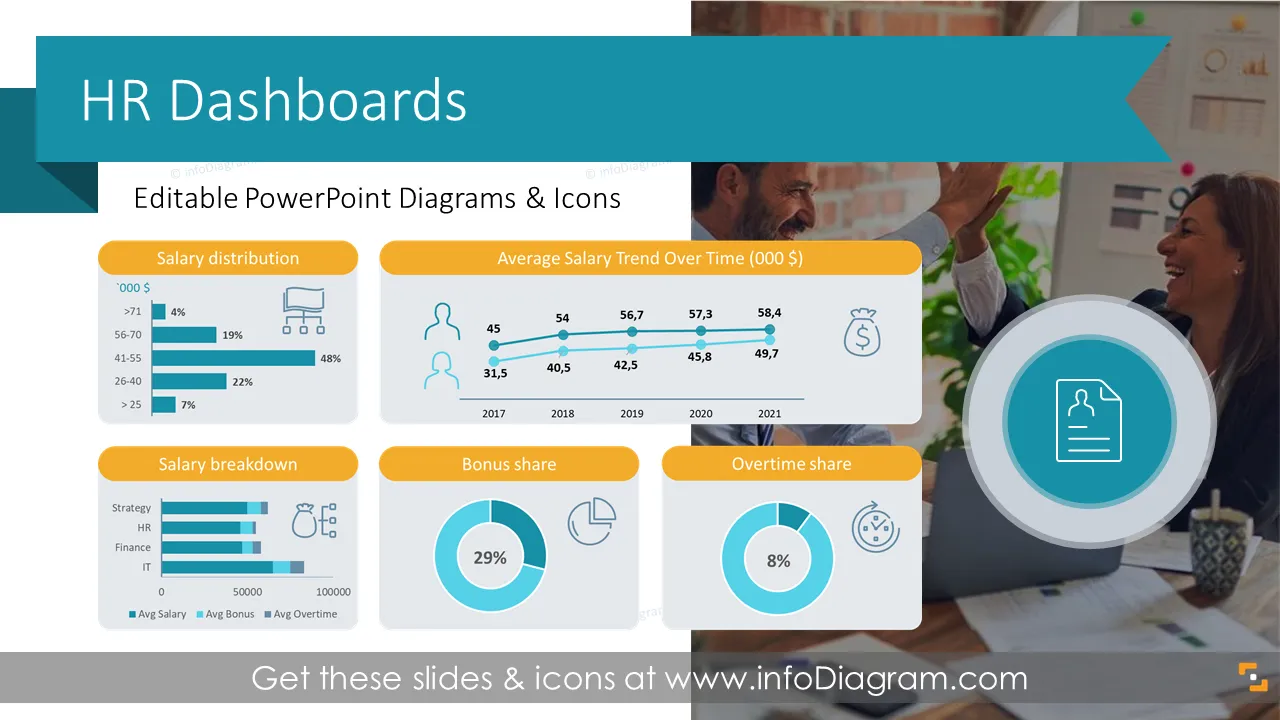
This HR Metrics Dashboard Data Charts for PowerPoint contains visual slides with:
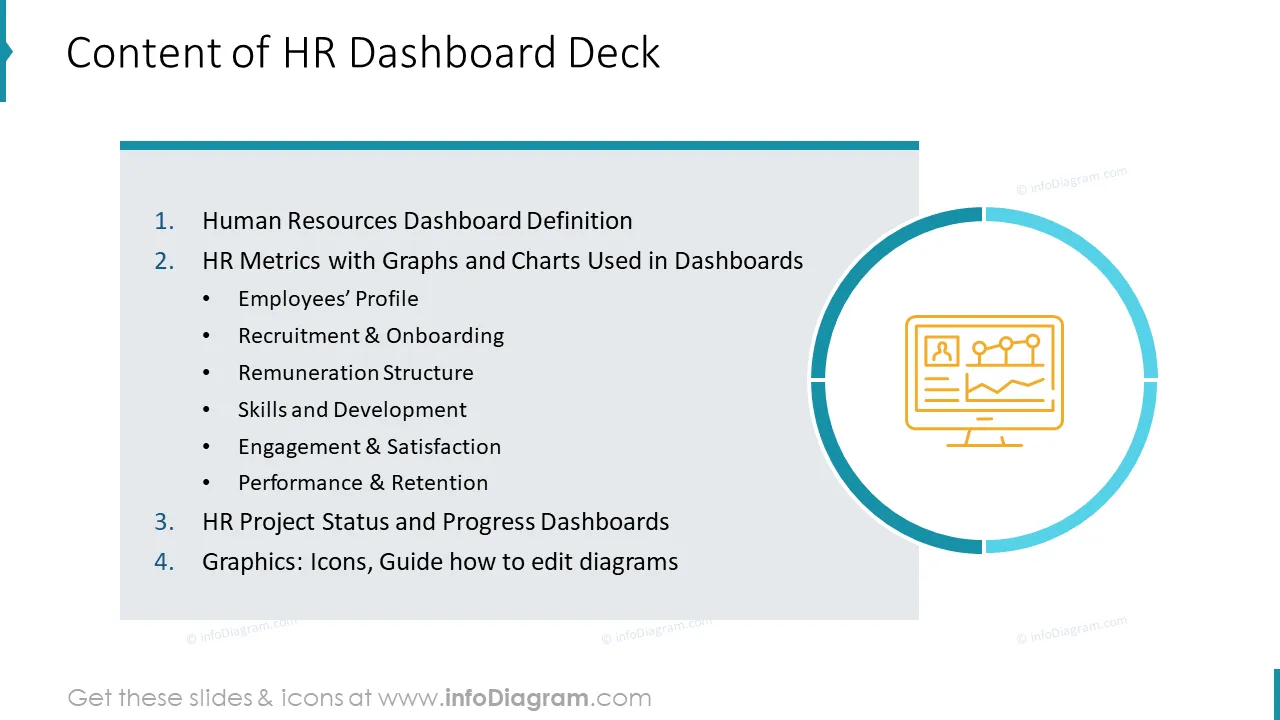
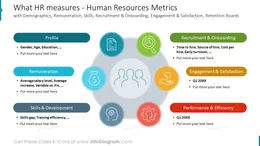
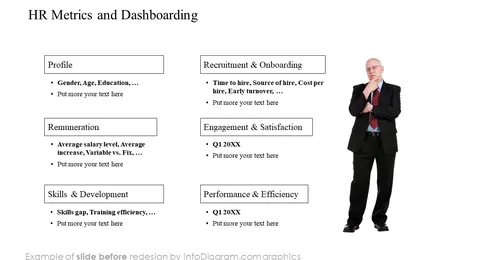
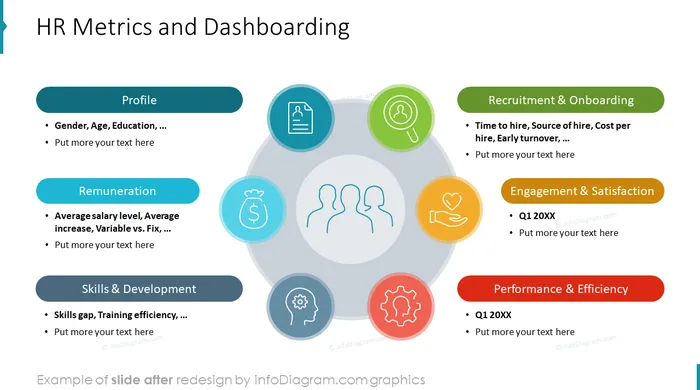
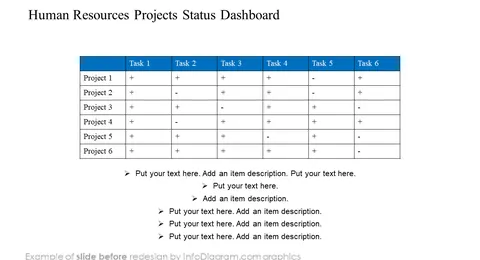
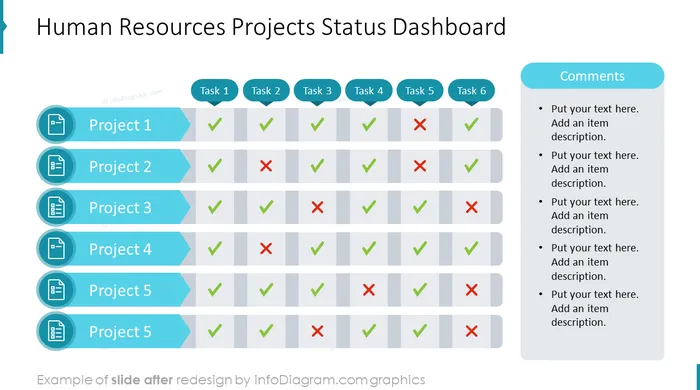
- 22 dashboard layouts to create visual dashboard slides for presenting human resources metrics and charts. Employees: Profile, recruitment and onboarding, remuneration structure, skills and development, engagement and satisfaction, performance and retention; HR project status and progress.
- This slide collection is designed in a modern outline style. Infographic templates and graphics will help you find the proper way to effectively project your thought process and create unique slides without too much information.
- 53 outline symbols to show HR concepts and statuses like various people icons, documents, thumbs up and down, finance, and other business icons.
- Instructions on how to modify those diagrams using standard PowerPoint editing tools.
Format: Fully editable vector shapes. (you can modify the colors of diagrams and icons, and resize them without quality loss).
What is an HR Metrics Dashboard?
An HR dashboard is a human resources management tool that visually tracks, analyses, and displays key performance indicators (KPI), metrics, and key data points to monitor the health of the HR department or specific HR process or project.
Why Use HR Dashboard PPT Templates?
Dashboards aggregate and visualize data from multiple sources, if you want your audience to quickly gain insights into the most critical aspects of your data, you can use our templates to convey your message. Using creative visuals to illustrate the data makes the information easy to understand. You can choose from various professional layouts, reuse our graphs and charts, add your comments, and tailor them to your needs to upgrade your presentation slides. The majority of our charts are data-driven Excel charts, so you can change the presented values with ease. We also included detailed instructions on how to edit the various elements, values, colors, and the general look of the charts.
Where can you use the HR dashboard PowerPoint Template?
You can use our pre-designed HR Dashboards to:
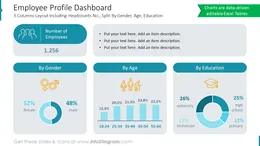
- Show your organization's employee profile by gender, age, or education.
- Analyze your headcounts by type of work, contract type, region, department, and overhead ratio.
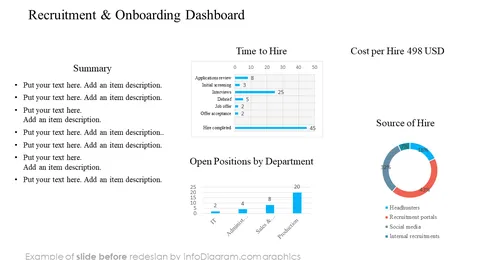
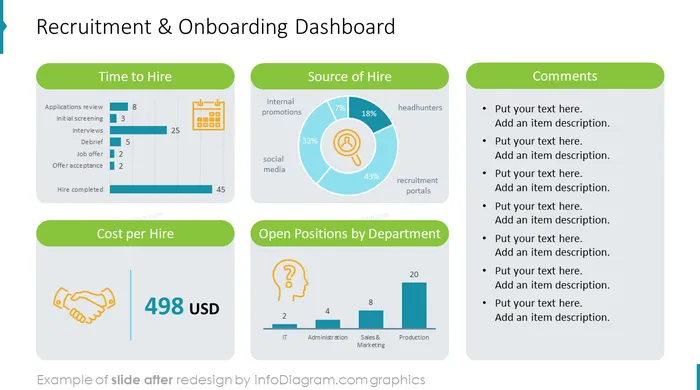
- Illustrate your recruitment and onboarding metrics such as time to hire, source of hire, cost per hire, or vacancies across departments or positions.
- Evaluate your remuneration levels including average salary trend over time, salary distribution by age, gender; salary breakdown to fix, bonus and overtime payments including shares visualization.
- Benchmark your salary compared to the minimum, market, industry, or competitors' wage levels.
- Visualize your remuneration changes year-over-year.
- Present your employees' skills matrix dashboard evaluating key competencies by department and positions.
- Use a competencies gap dashboard showing skill priorities, requirements, and deviations in a clear-to-understand radar chart.
- Design your employee's engagement and satisfaction dashboard in a gauge chart format, comprising such metrics as eNPS, Retention, and absenteeism ratios.
- Create your employees' retention dashboard with retention and staff turnover ratio analysis over a given period.
- Create employees' efficiency dashboard with revenue and profit per FTE and salary to revenue ratio.
- Design human resources project status or progress dashboards with tasks and checklist tables or with completion, time, and budget gauges.
Try using those PowerPoint illustrations to present your content visually in an elegant way.
All graphics are editable, so you can modify the colors and text. We also added a general icon collection at the end of the presentation deck. Optionally you can also extend the collection by more PPT symbols (see Related Diagrams section).
Fully editable in PowerPoint set of vector shapes fully editable by using built-in PowerPoint tools, including
- change the color of all shapes filling and their outline, including icons
- adding shadows
- changing shape and size, rotating, flipping the object
- putting shapes behind or on top of text
See the editing demonstration in our HowTo Videos.
Authors
- Design by infoDiagram's designer.
Contact: here
Further resources
To deepen your understanding and skills, we suggest exploring additional materials such as our blog and YouTube video, which are trusted sources dedicated to refining presentation decks:
Slides included in this PowerPoint Presentation: