Your graphics add a nice touch to my presentations and I recently used them for one of my all-hands meetings. Your toolbox adds professionalism to my slides. Instead of using standard clipart.
Claude Jones, Director of Engineer, @Walmartlabs, USA

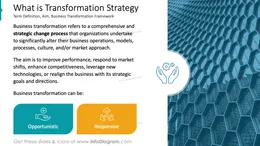

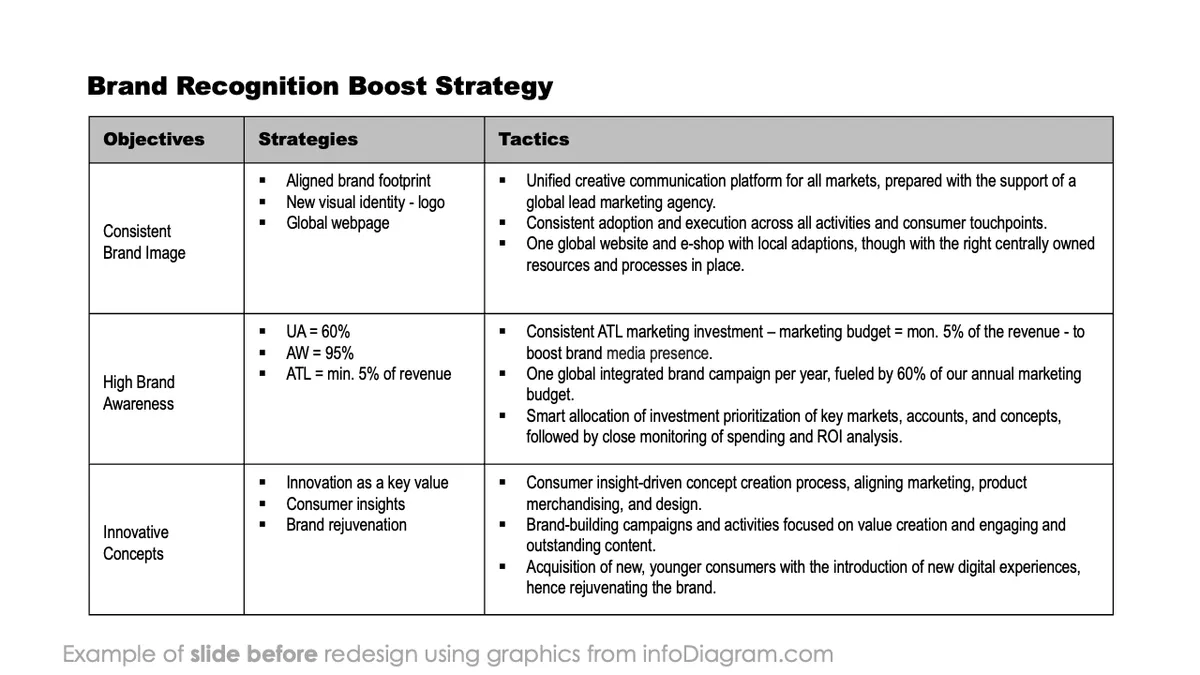
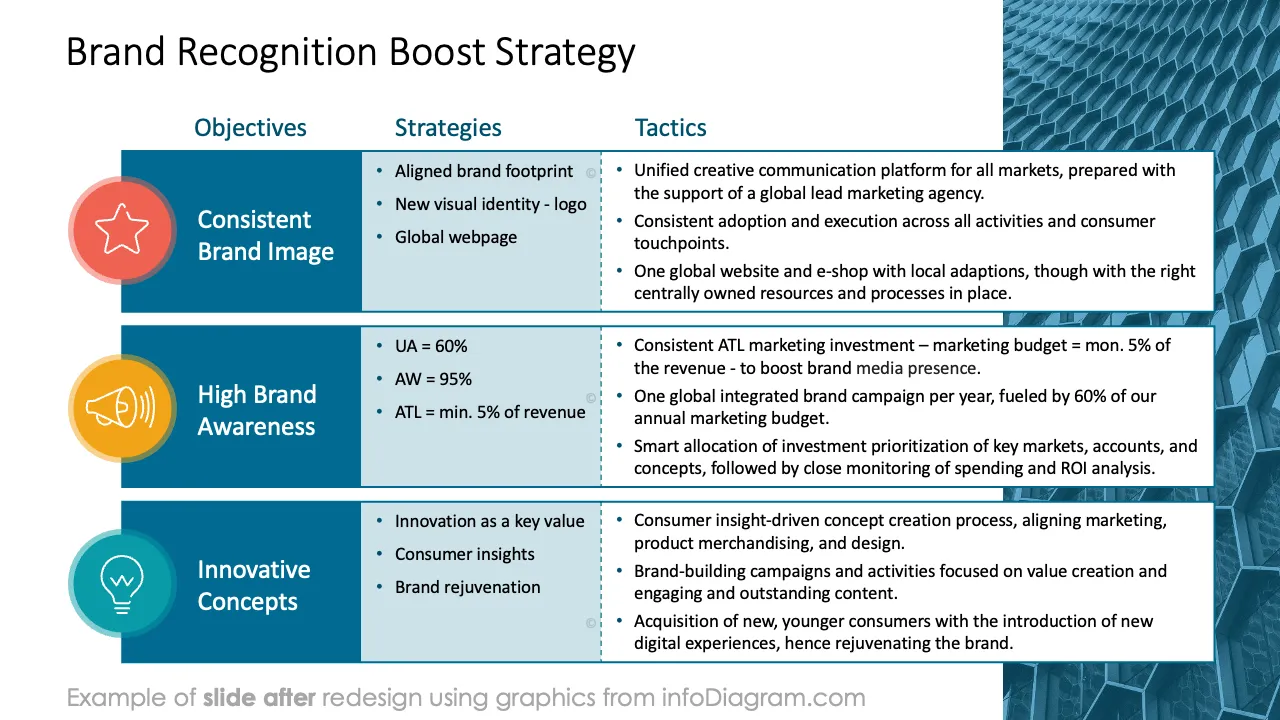
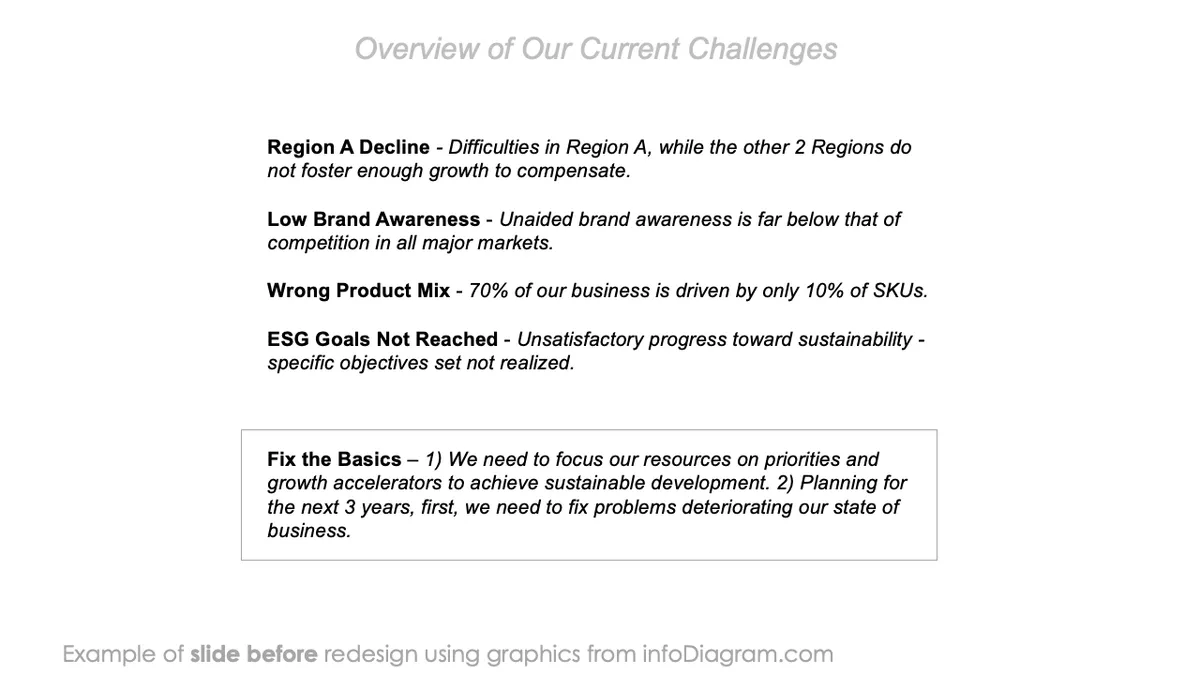
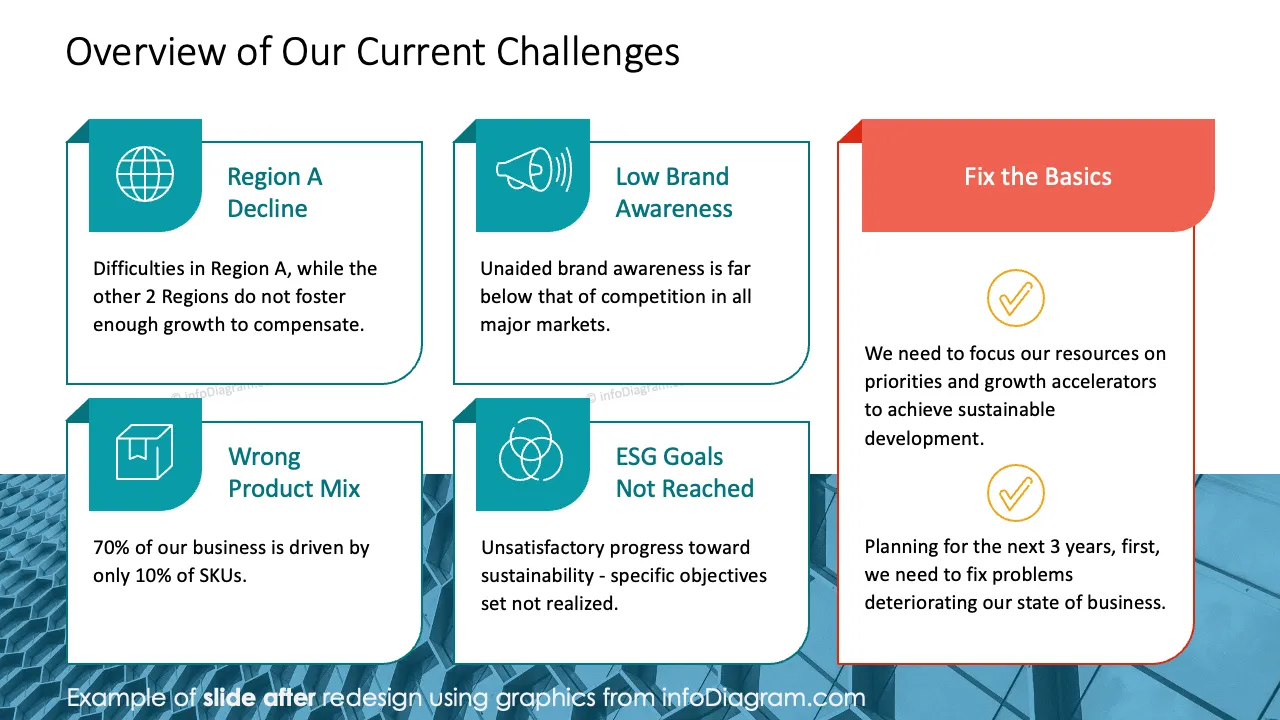
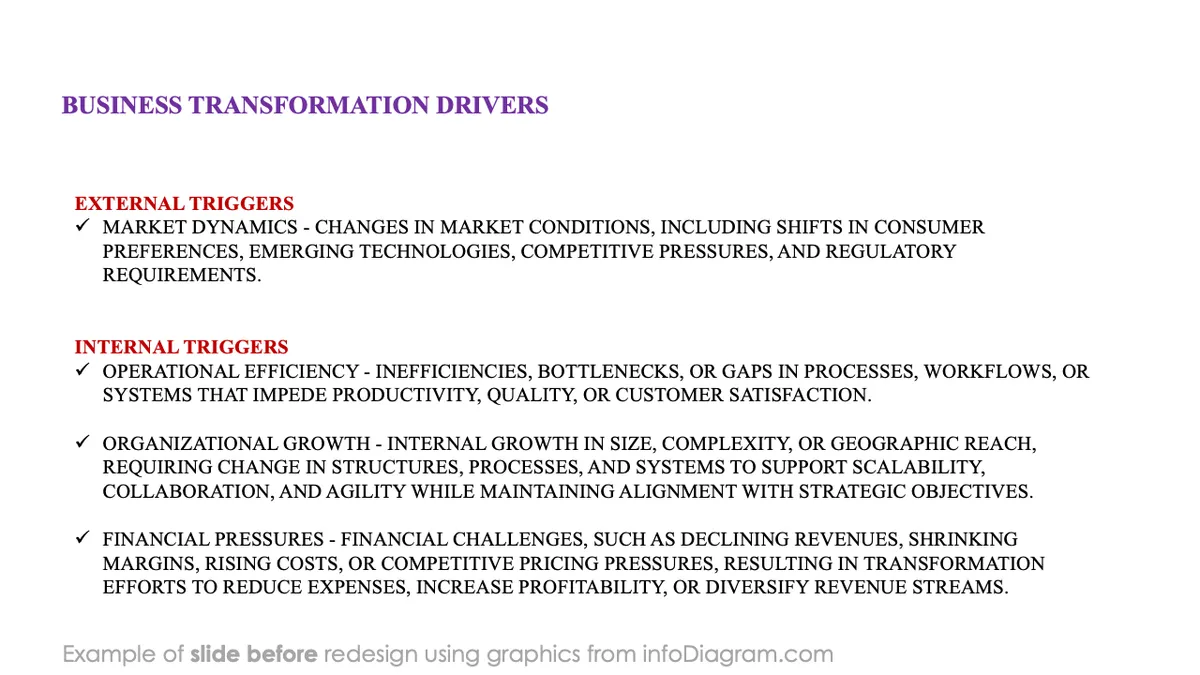
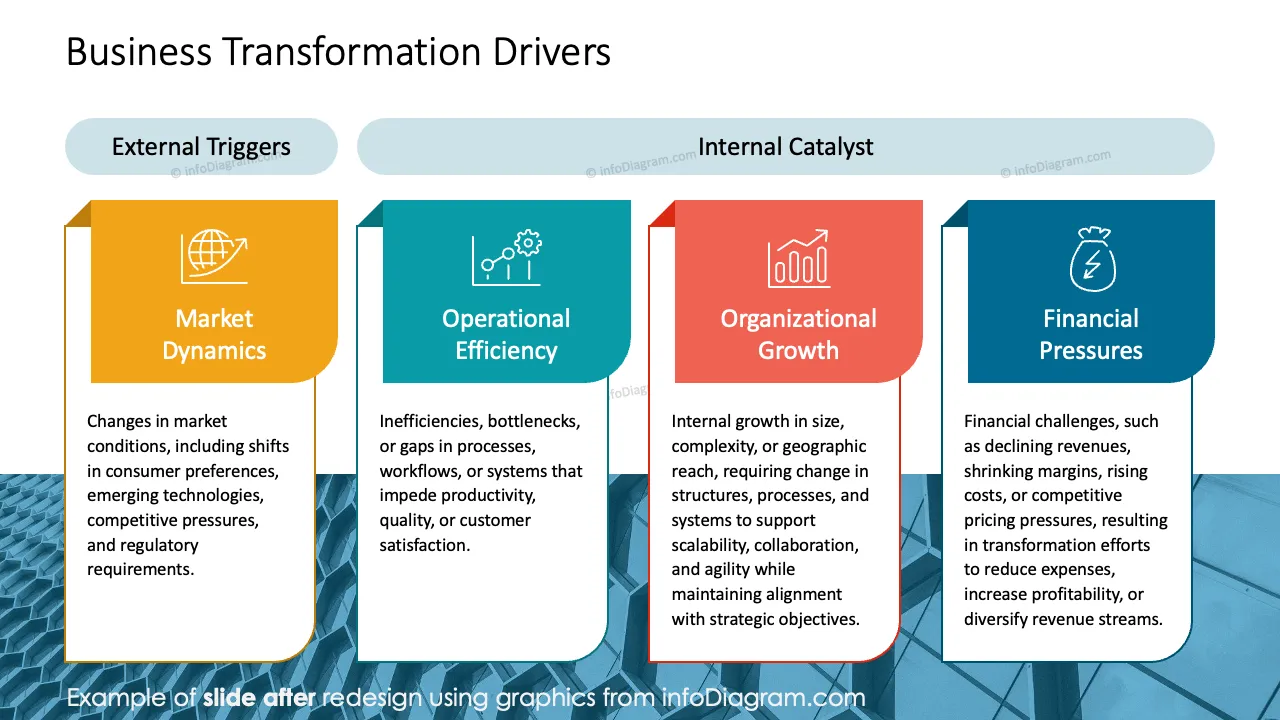
Before and after
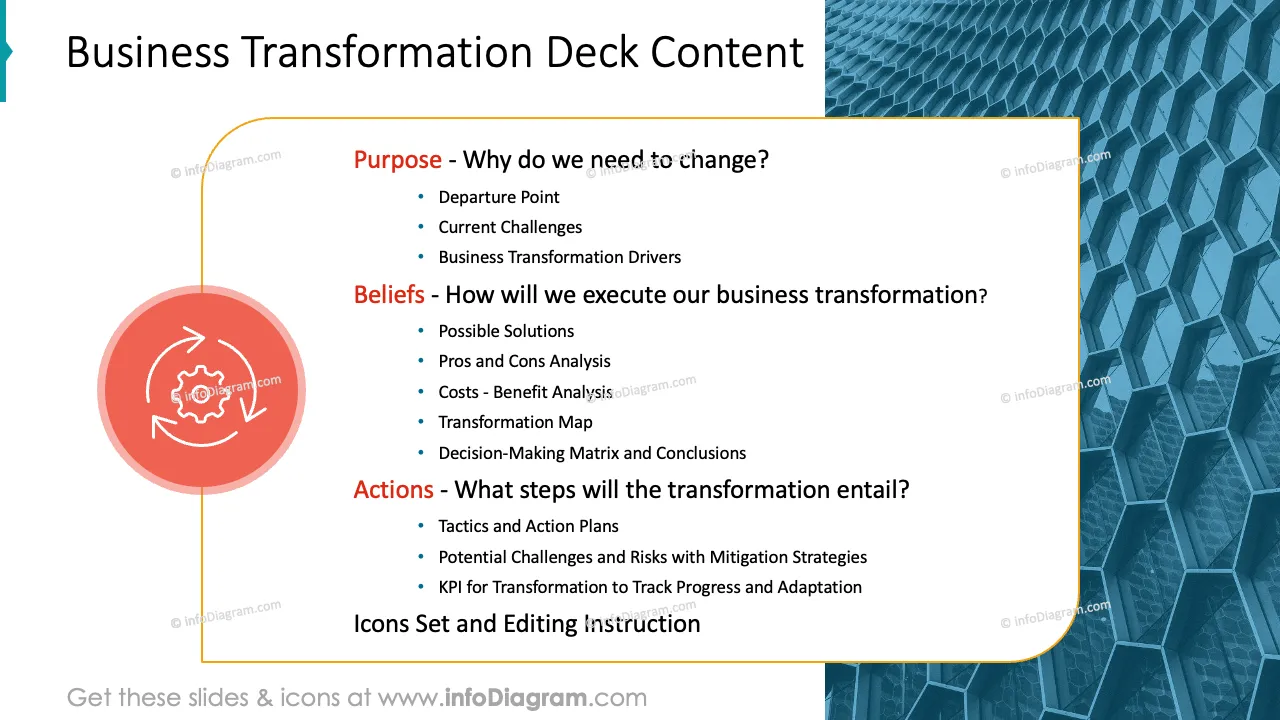
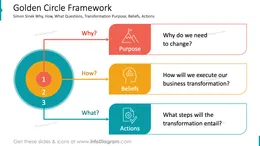
Do you need to present a comprehensive business transformation plan with significant changes to be done across various aspects of your business? Use our pre-design deck that incorporates key business challenges and trends and present your strategy in a clear, informative, and visually appealing manner.
This PowerPoint slide deck is designed in an elegant, flat style with colorful vector illustrations and outline icons. All graphic shapes can be recolored and resized without quality loss.
Business transformation refers to an organization's strategic, comprehensive process to fundamentally change its operations, structures, processes, or business models. The primary goal is to improve performance, enhance competitiveness, and adapt to evolving market conditions, technologies, and customer expectations. This process often involves significant changes across various aspects of the business, including organizational culture, technology, workflows, and customer interaction.
If you need to communicate your business transformation plan, use our templates to help you present it in an eye-catching and attractive format. This will allow you to engage various stakeholders and align or document the transformation process, ensuring that all are informed, involved, and supportive of the changes.
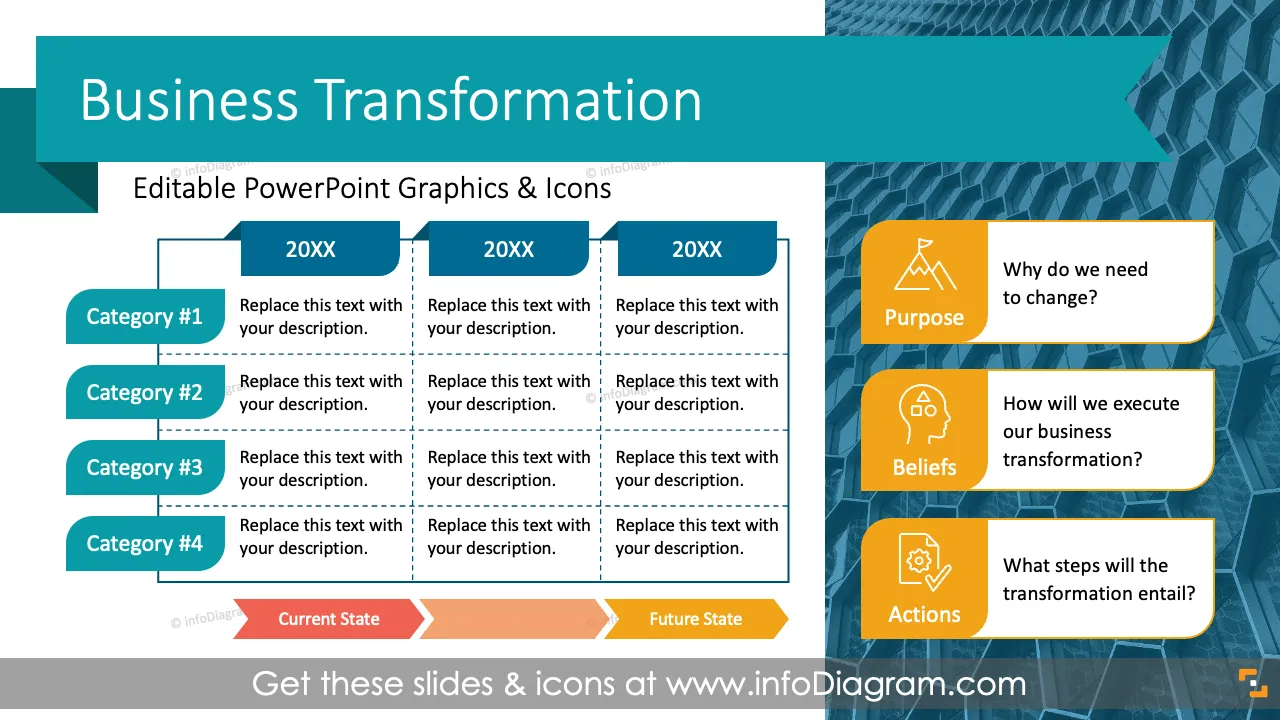
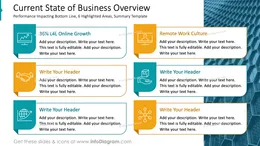
Use graphs and infographic elements to make your ideas easy to understand. Tailor them to your needs to upgrade your presentation slides. Design flowcharts of your projects and use pre-designed project templates that offer space for your tactics, actions, and expected deliverables. We include detailed instructions on how to alter the content, values, colors, and look and feel of the charts.
Using infographics in your business transformation presentation will help you organize information in a visually appealing format and present your ideas in a compelling way that is easy for your audience to understand.
Try using those PowerPoint graphics to present your data visually in an elegant way.
All graphics are editable to modify the size, colors, and text. Also, you can extend the collection further with more PPT symbols (see Related Diagrams section).
Try using thisset of fully editable PowerPoint vector shapes to present your data visually in an elegant way. You can easily modify all elements:
Your graphics add a nice touch to my presentations and I recently used them for one of my all-hands meetings. Your toolbox adds professionalism to my slides. Instead of using standard clipart.
Claude Jones, Director of Engineer, @Walmartlabs, USA
I needed a fresh look at some of my slides. I've tried to find a way to create a paintbrush effect, to underline, accentuate, add some color and the handwritten markers were just the things. Very easy to use, easy to size, change the color. It was an affordable, perfect solution and I'm happy to recommend it.
Anonymous, US
The crisp, clean look of the graphics, and the fact that it allowed me to easily edit and change the colors to match the template was my main reason for purchasing them.
Brandie Jenkins, E-learning Developer, USA


You may also need