
Your graphics add a nice touch to my presentations and I recently used them for one of my all-hands meetings. Your toolbox adds professionalism to my slides. Instead of using standard clipart.
Claude Jones, Director of Engineer, @Walmartlabs, USA
Your graphics add a nice touch to my presentations and I recently used them for one of my all-hands meetings. Your toolbox adds professionalism to my slides. Instead of using standard clipart.
Claude Jones, Director of Engineer, @Walmartlabs, USA
I needed a fresh look at some of my slides. I've tried to find a way to create a paintbrush effect, to underline, accentuate, add some color and the handwritten markers were just the things. Very easy to use, easy to size, change the color. It was an affordable, perfect solution and I'm happy to recommend it.
Anonymous, US
The crisp, clean look of the graphics, and the fact that it allowed me to easily edit and change the colors to match the template was my main reason for purchasing them.
Brandie Jenkins, E-learning Developer, USA
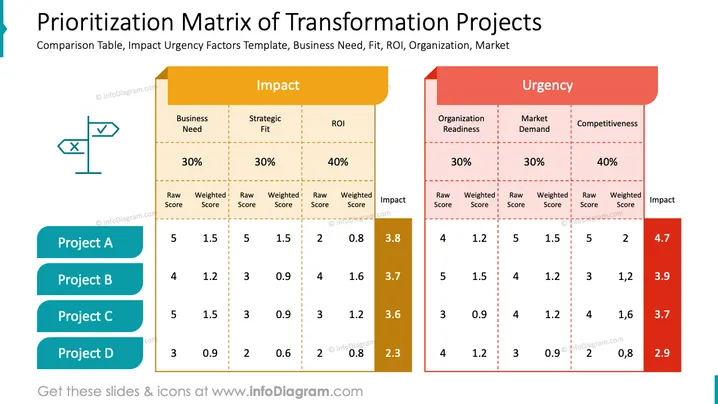
The slide depicts a prioritization matrix focusing on the impact and urgency of transformation projects. It is used to evaluate and compare projects (A, B, C, D) based on certain criteria within two main categories: Impact and Urgency. Impact is assessed through Business Need, Strategic Fit, and Return on Investment (ROI), with weights of 30%, 30%, and 40% respectively. Urgency is evaluated by Organization Readiness, Market Demand, and Competitiveness, also with weights of 30%, 30%, and 40%. Each project is scored on these criteria, given a raw and a weighted score, and an overall impact score is calculated for both Impact and Urgency.
The slide has a harmonious color scheme with contrasting colors to denote different aspects of the matrix clearly. The use of bars and colors provides a quick visual representation of the data.




