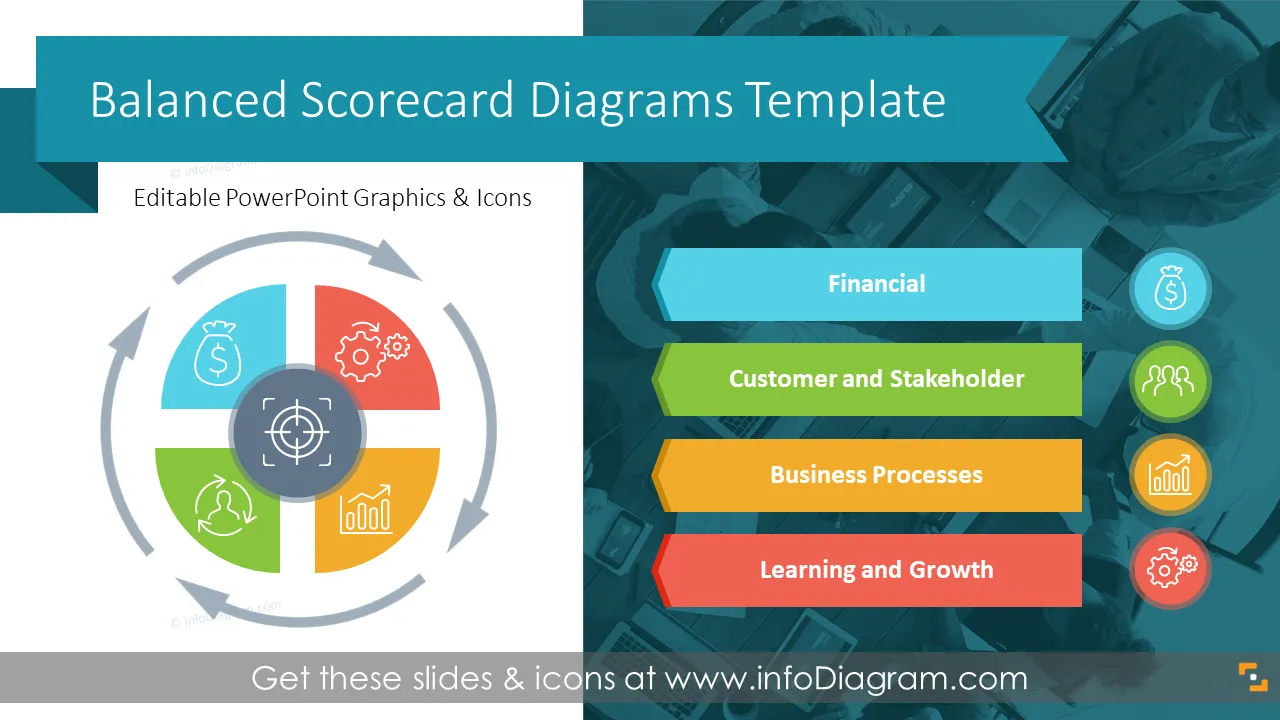
Do you need to foster communication, alignment, and performance improvement across various levels of your organization? Use this balanced scorecard PPT design to describe different perspectives of your organization, which is described as the financial perspective, customer or investors perspective, organizational growth perspective, and the internal process perspective.
This Balanced Scorecard Strategy Presentation template contains slides with the following:
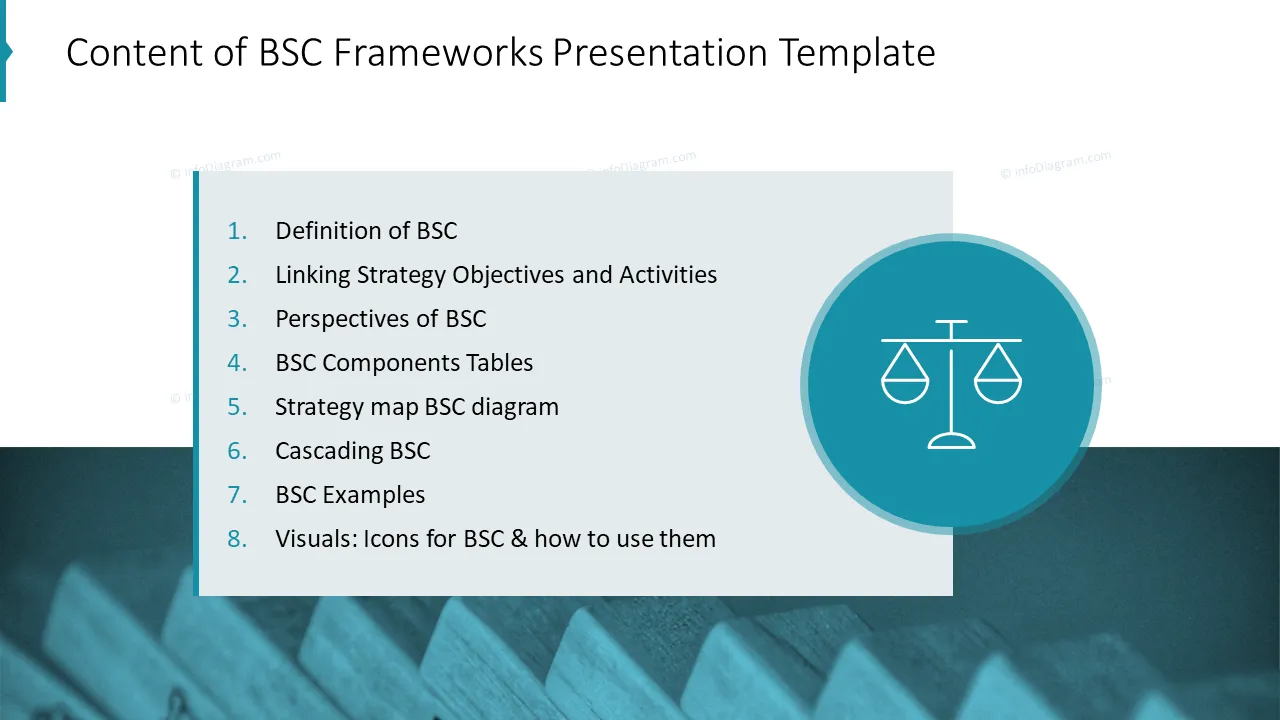
- 16 diagrams illustrating various issues related to scorecard planning and execution
- 39 icons illustrating scorecard topics: Organizational Management, Business Performance, and Status Indicators
- Instruction on modifying those diagrams using standard PowerPoint editing tools.
This PowerPoint slide deck is designed in an elegant flat style with colorful vector illustrations and outline icons. All graphic shapes can be recolored and resized without quality loss.
Authors of this Balanced Scorecard Strategy Presentation template:
What is a Balanced Scorecard Strategy diagram in MS Office PowerPoint?
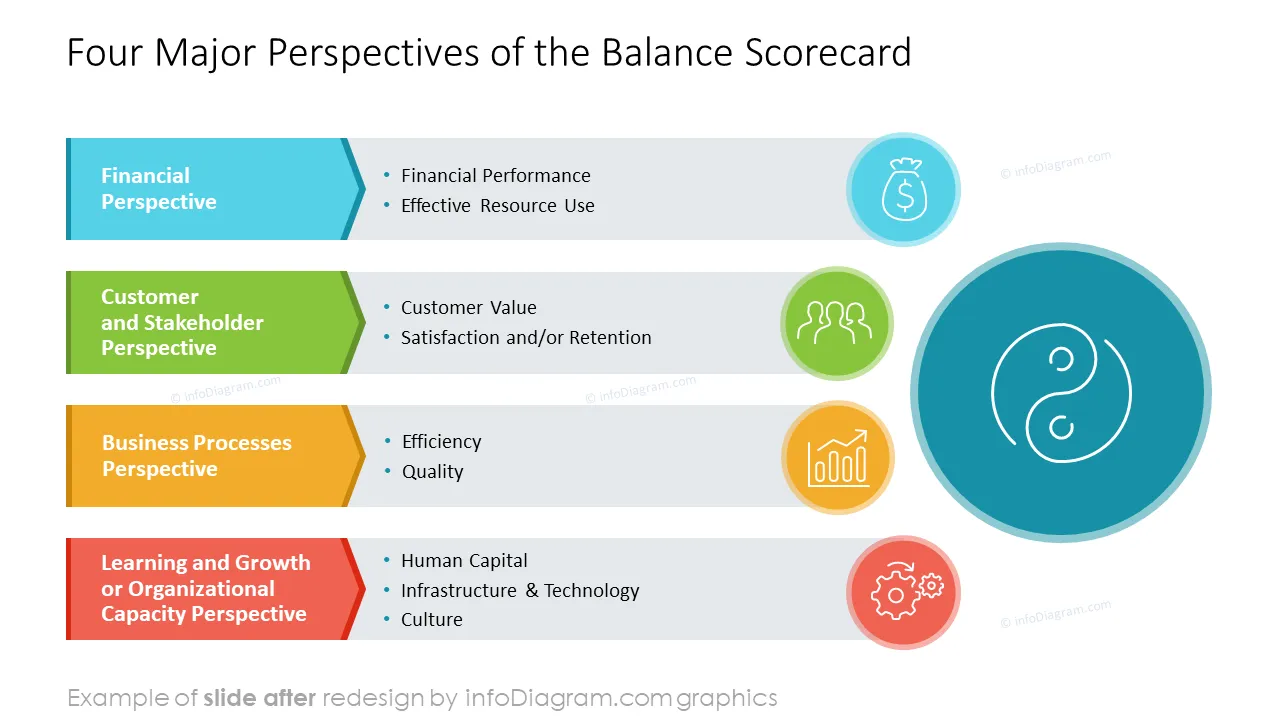
The Balanced Scorecard (BSC) is a strategic management framework designed to help organizations translate their strategic objectives into a set of comprehensive performance measures. The Balanced Scorecard goes beyond traditional financial metrics to include non-financial indicators, offering a more balanced view of an organization's performance. It typically consists of four perspectives: financial, customer, internal processes, and learning and growth.
Why use a visual way of presenting the Balanced Scorecard Strategy?
If you are looking for a powerful tool to improve strategic planning, execution, and overall performance in a balanced and integrated manner across your organization, the Balance Scorecard is just for you. Use our pre-designed, content-ready slides, modify them to your needs, add comments, and enjoy your presentation!
Where can you use the Balanced Scorecard Strategy PPT template?
Using infographics in your balanced scorecard presentation will help you organize information in a visually appealing way and present your roadmap from strategy objectives to actions in an attractive and compelling way that is easy for your audience to understand.
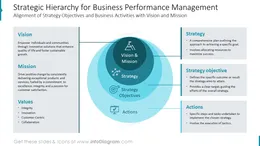
- Present your strategic objectives and business activities aligned with your vision and mission
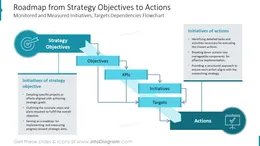
- Create an attractive roadmap from objectives to actions
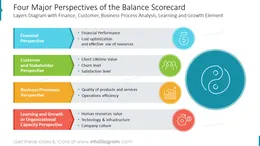
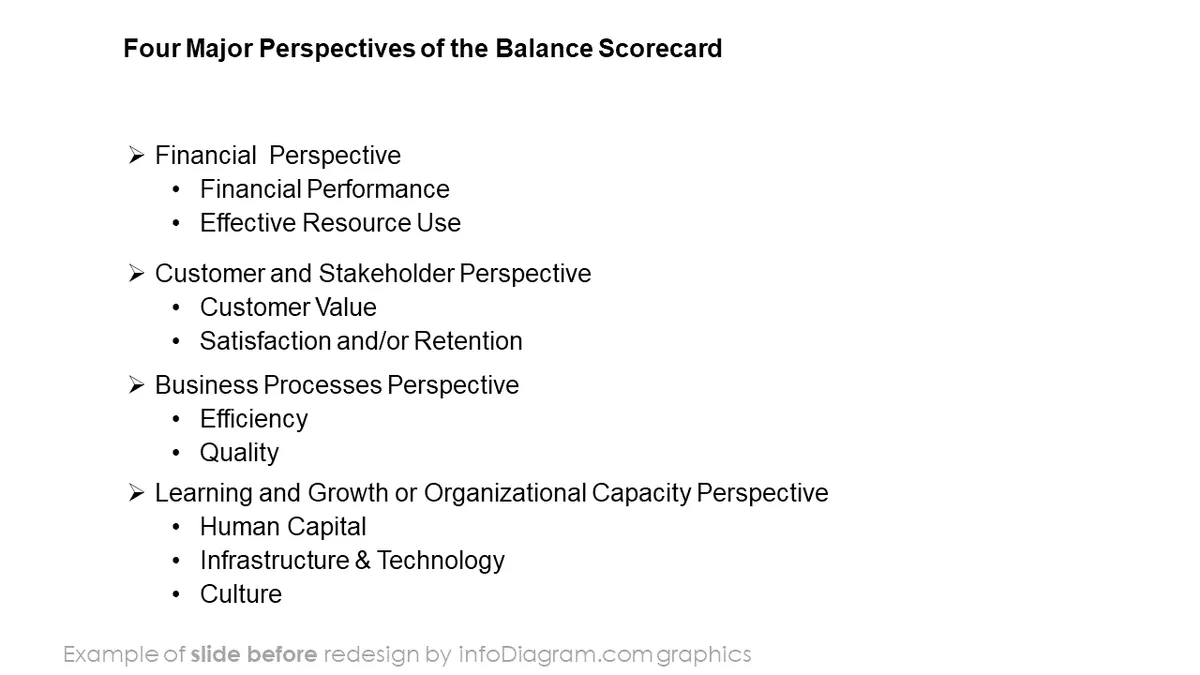
- Show four major perspectives of the balanced scorecard in flat layers or quadrant matrix versions
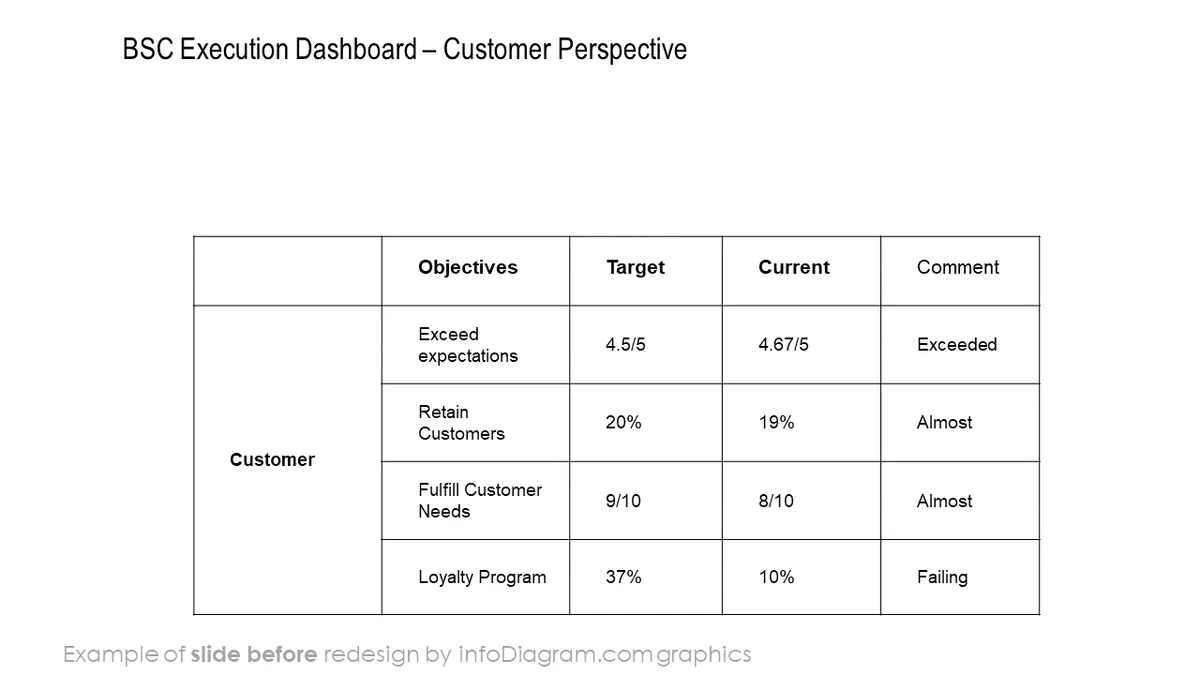
- Incorporate balanced scorecard components and perspectives, including objectives, targets, key measures, and initiatives, into a table template
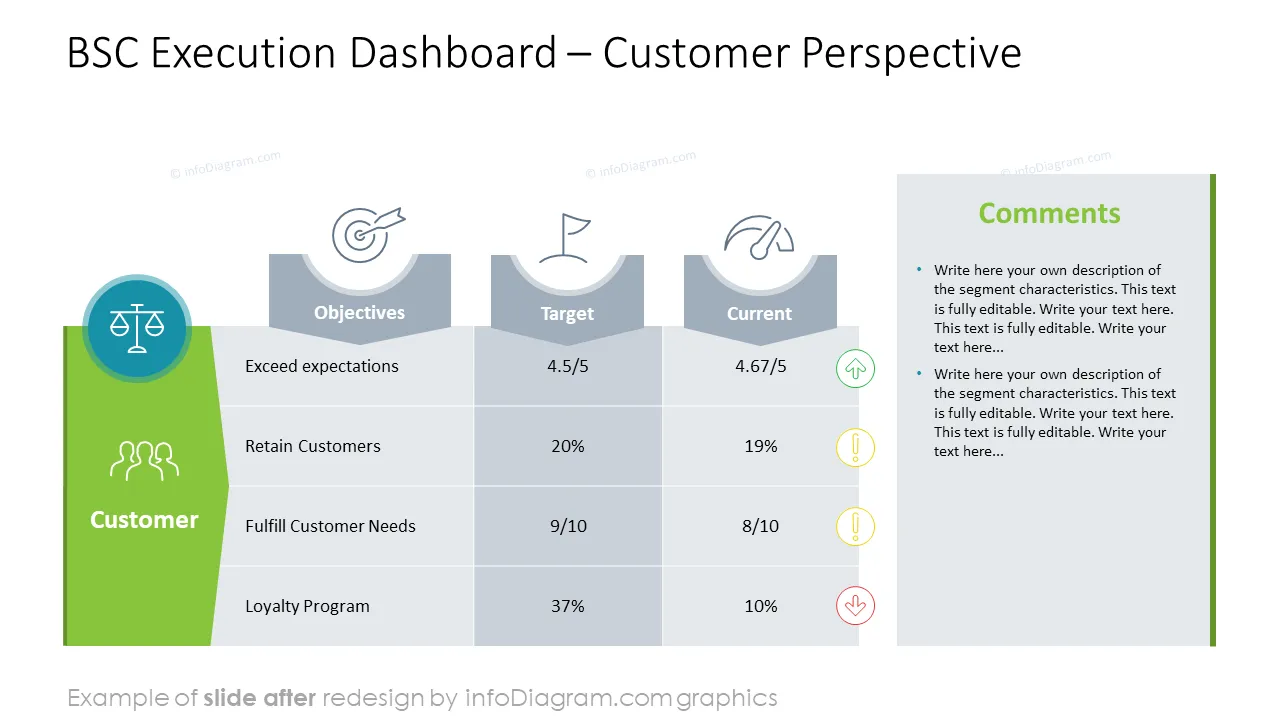
- Visualize your performance execution in an appealing dashboard template accompanied by your comments or progress report table.
- Illustrate, using arrow connections, the cause-and-effect relationships in your strategy map diagram
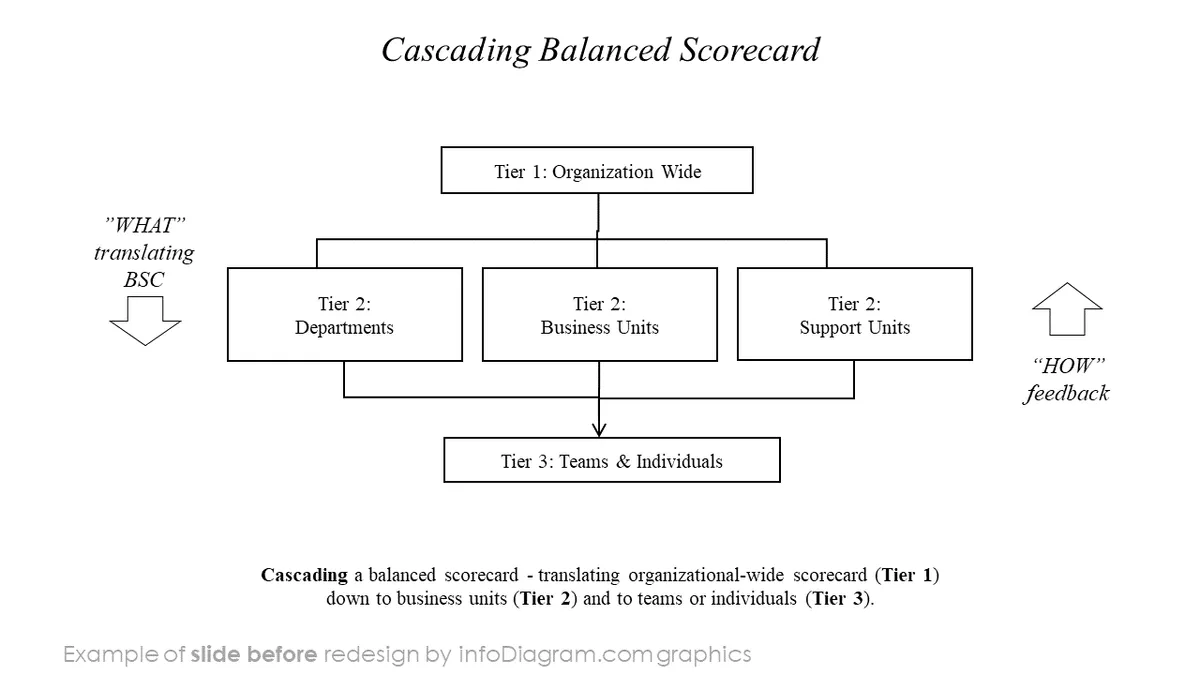
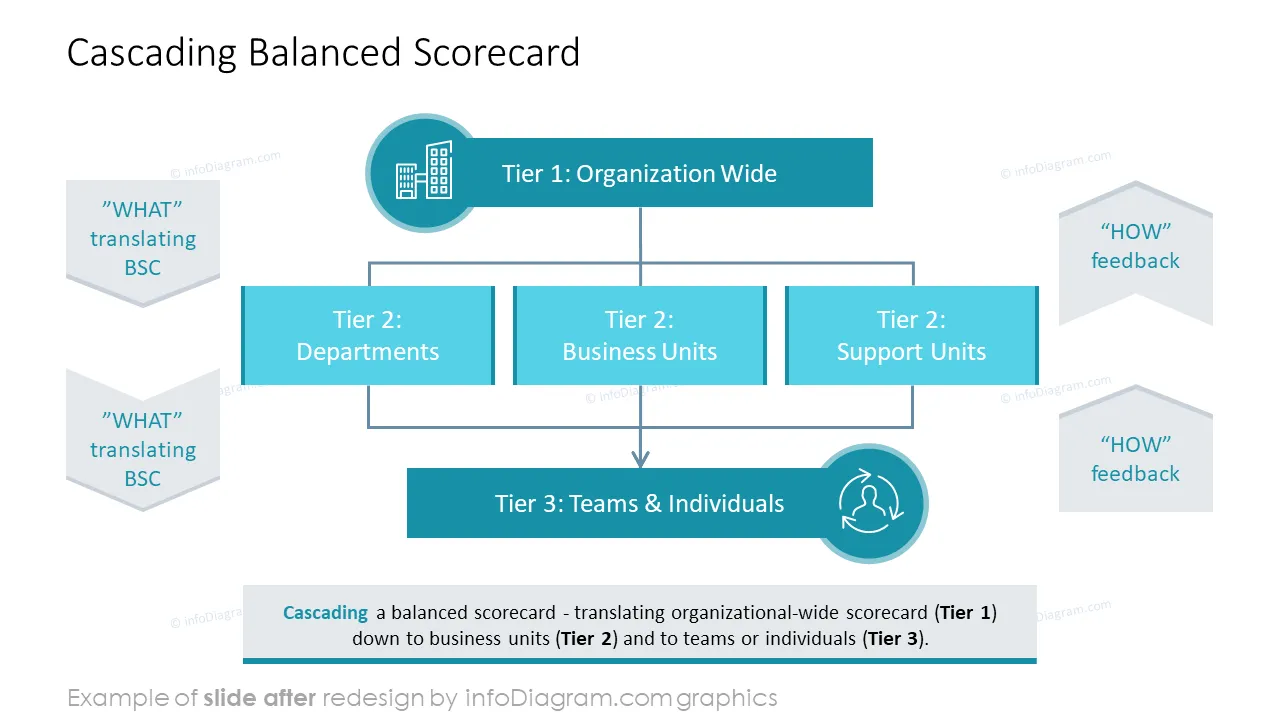
- Translate high-level strategic objectives into actionable initiatives via cascading a strategy map
Try using those PowerPoint graphics to present your data visually in an elegant way.
All graphics are editable to modify the size, colors, and text. Also, you can extend the collection further with more PPT symbols (see Related Diagrams section).
Try using thisset of fully editable PowerPoint vector shapes to present your data visually in an elegant way. You can easily modify all elements:
- Replace icons
- Change the filling and outline color
- Modify size and proportions
- Rotate, flip, align, and change order
Slides included in this PowerPoint Presentation: