Your graphics add a nice touch to my presentations and I recently used them for one of my all-hands meetings. Your toolbox adds professionalism to my slides. Instead of using standard clipart.
Claude Jones, Director of Engineer, @Walmartlabs, USA
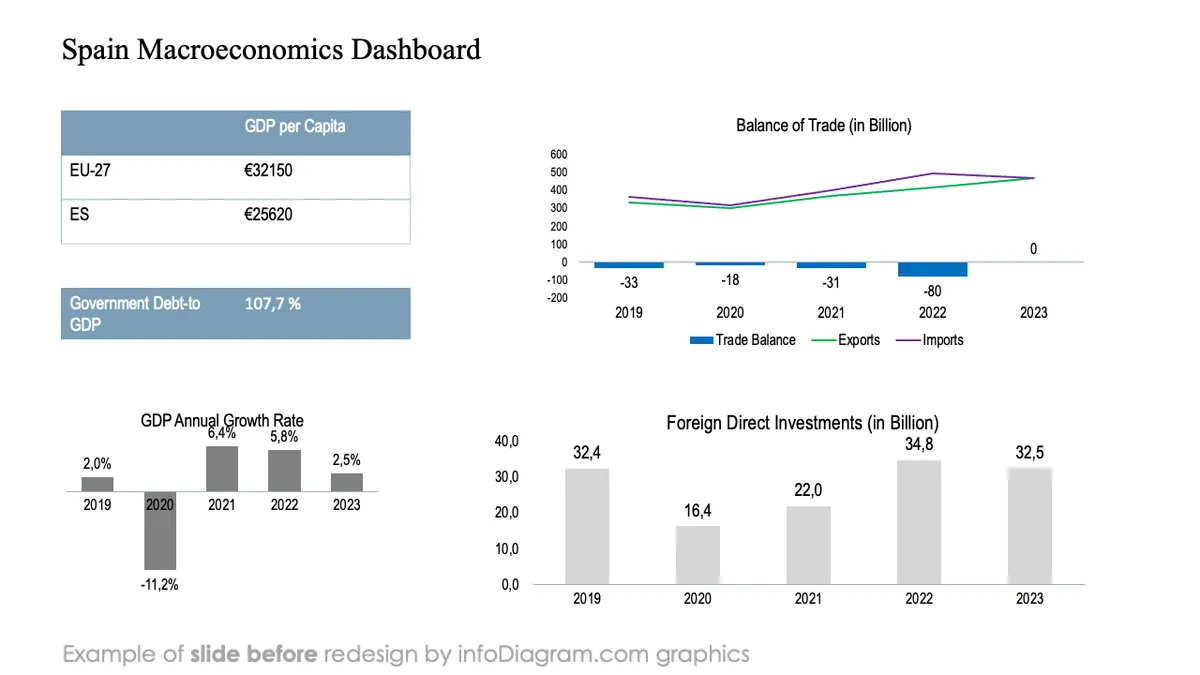
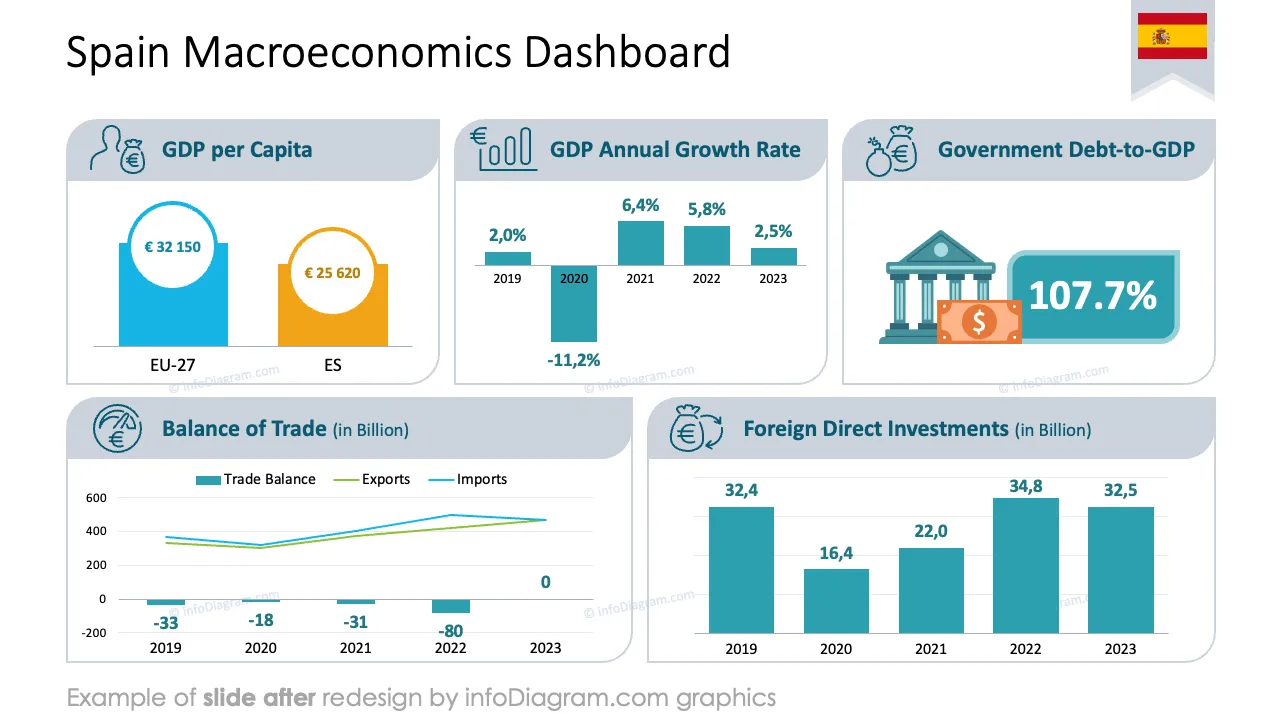
Before and after
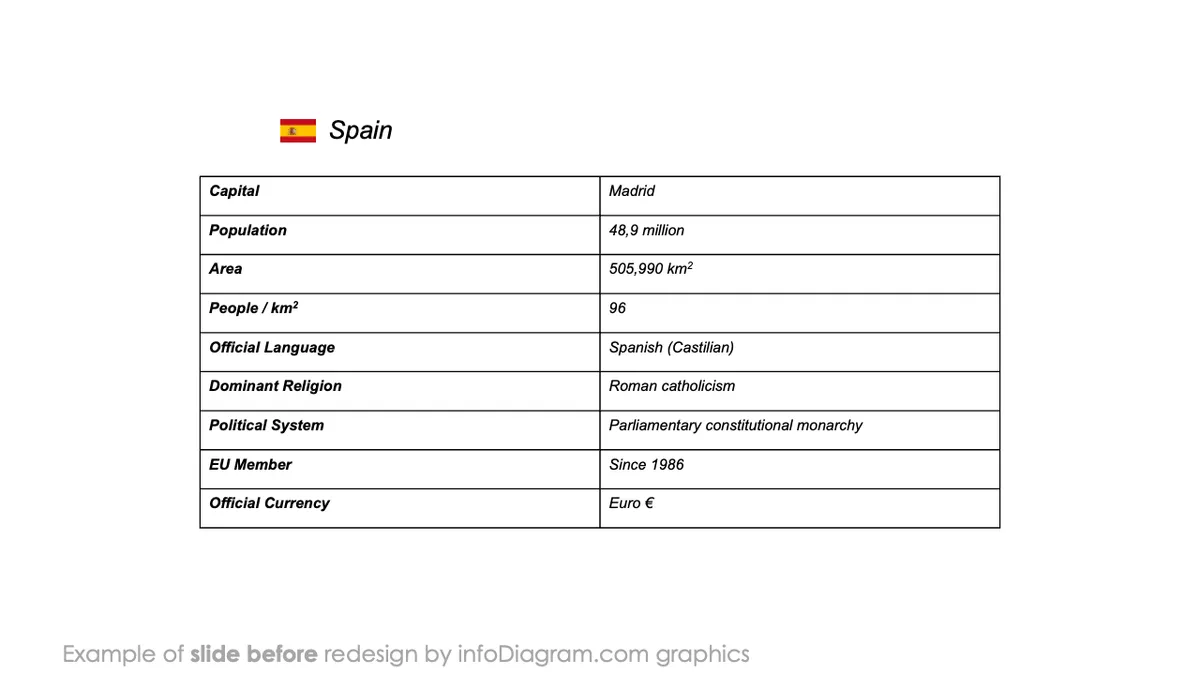
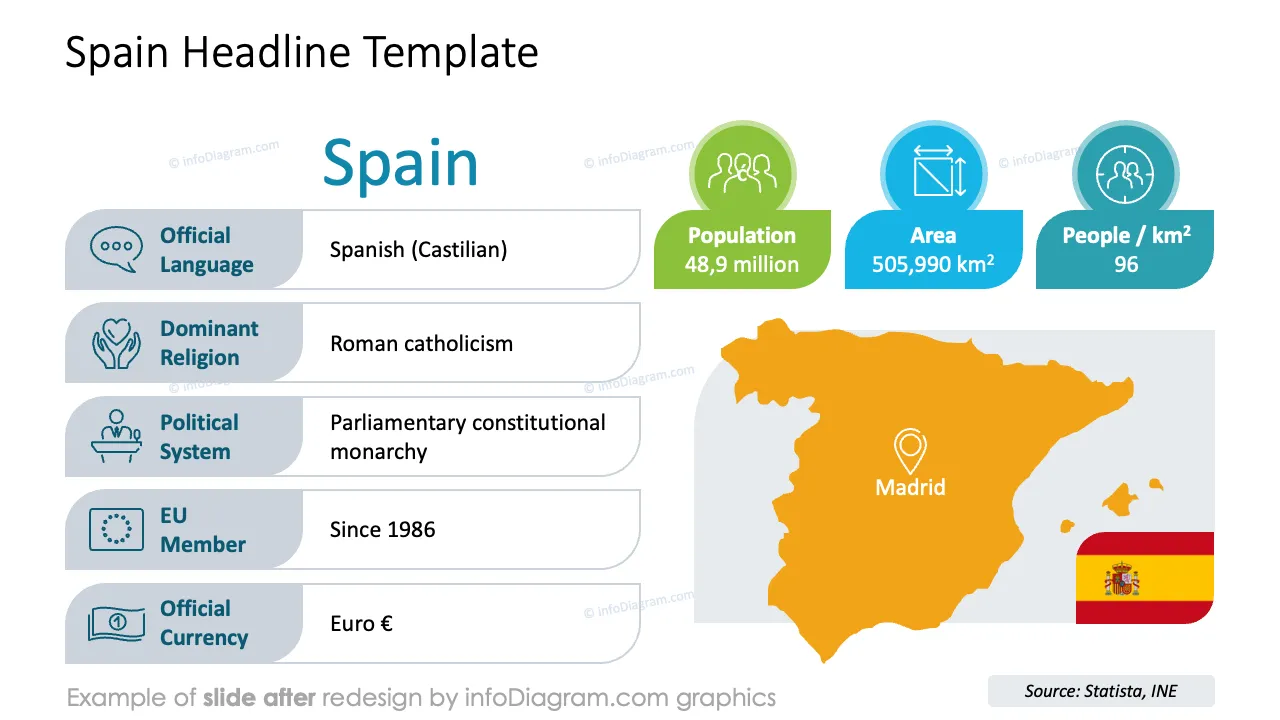
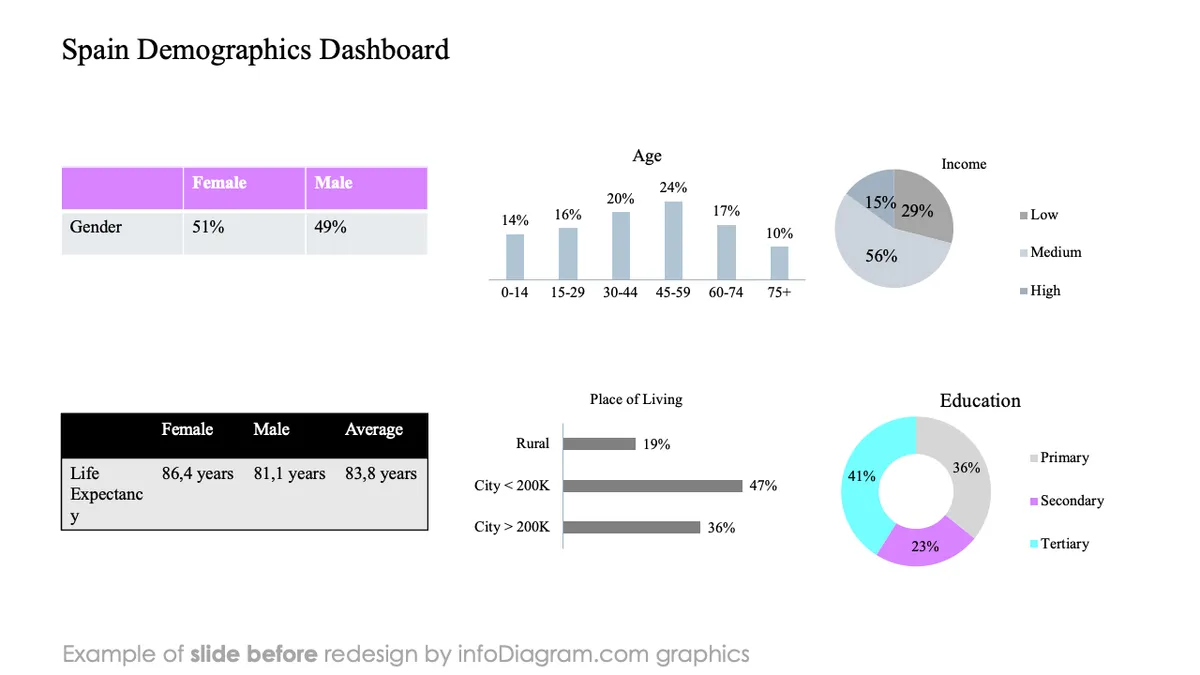
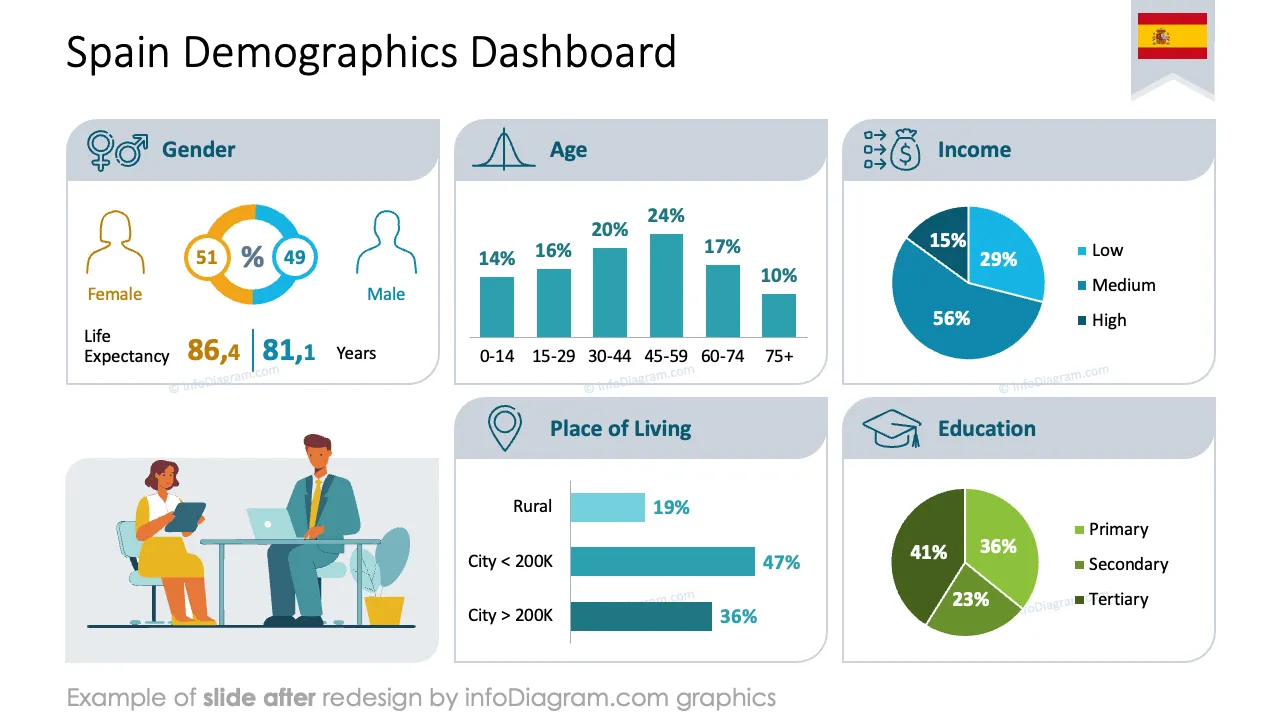
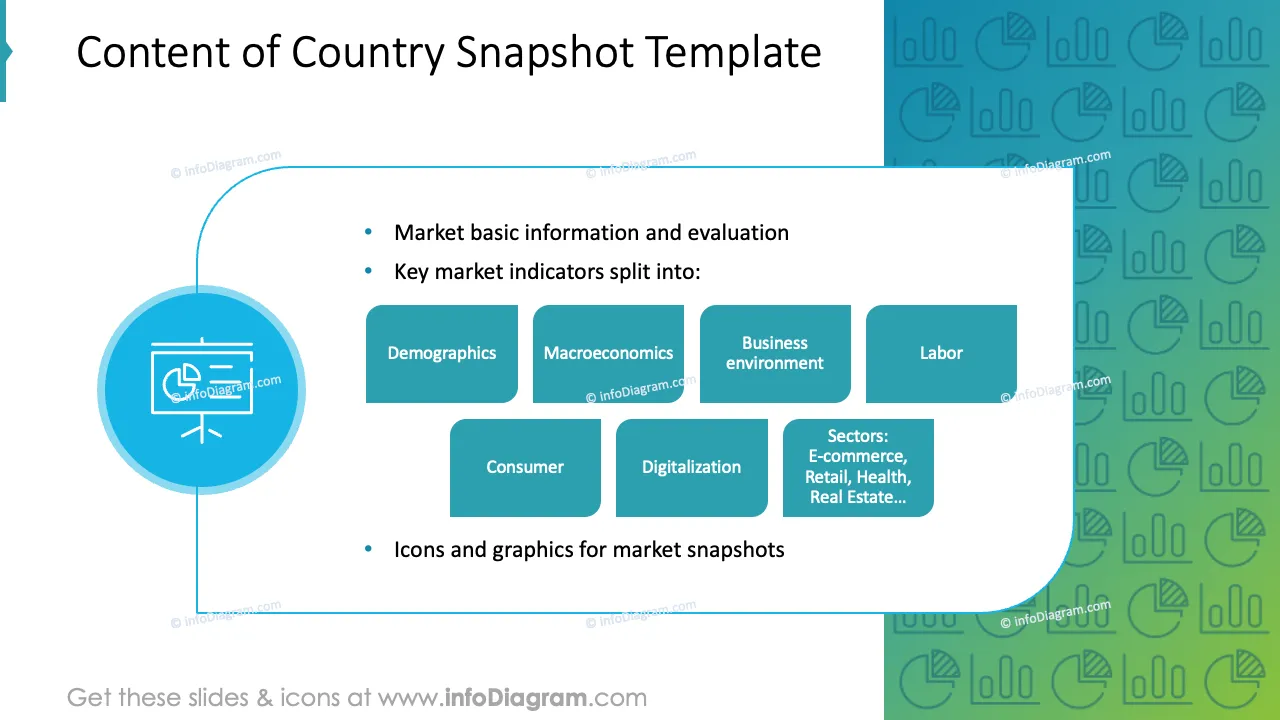
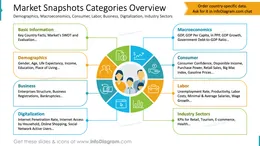
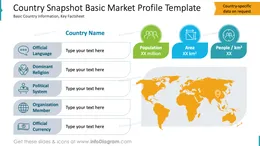
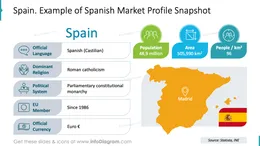
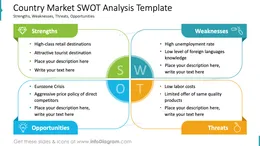
Do you need to present a comprehensive and easy-to-follow overview of a specific country that outlines the key data? Use our Market Snapshot deck highlighting a variety of aspects that should be considered while presenting a particular market.
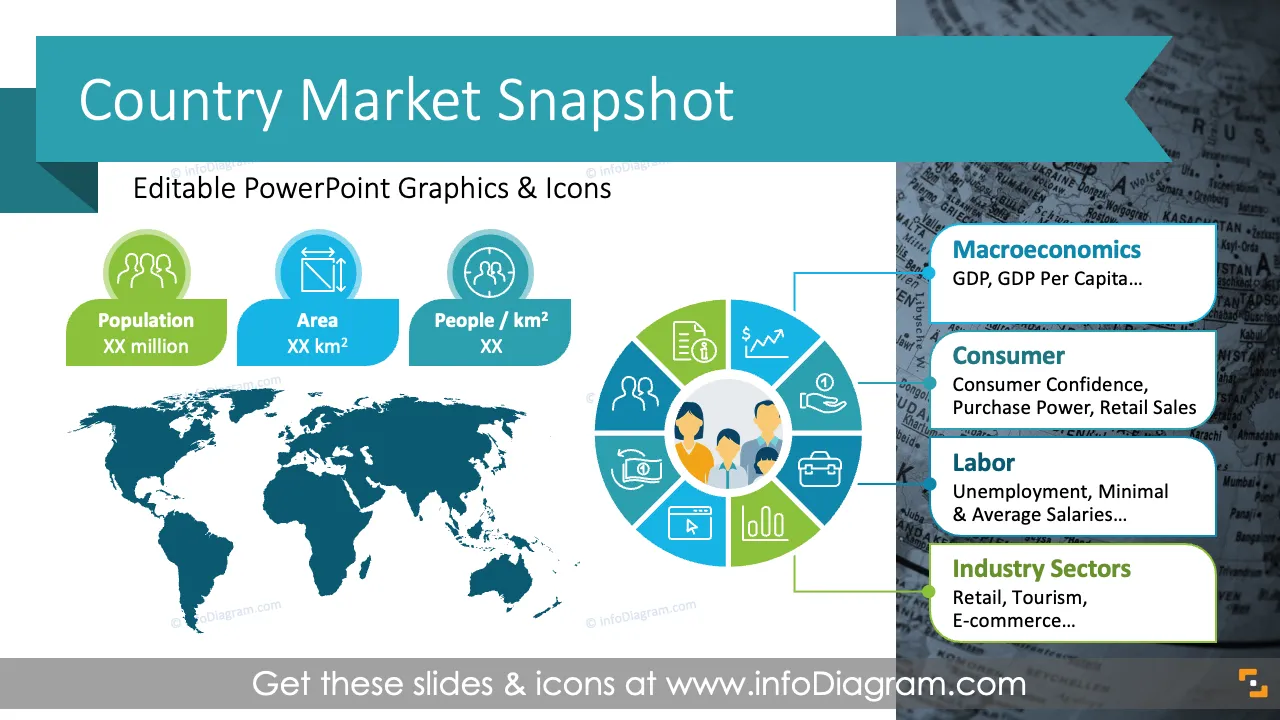
This PowerPoint slide deck is designed in an elegant, flat style with colorful vector illustrations and outline icons. All graphic shapes can be recolored and resized without quality loss.
A market snapshot is a concise and real-time overview of the current state of a particular market at a specific moment. It typically includes key data points and trends, offering a high-level summary of critical market information.
A market snapshot helps investors, analysts, and business leaders make quick, informed decisions by providing a summary of the most relevant data at a given time. It’s useful for both short-term decision-making and identifying potential longer-term market trends.
Using visual aids helps you to present a specific market in an eye-catching and attractive format. You can reuse our PowerPoint graphics and charts templates, and tailor them to your needs, to upgrade your presentation slides.
Most of our charts are data-driven Excel charts, so it is easy to change the values presented. Slides contain instructions on how to alter the content, values, colors and feel of the charts.
Using infographics in your presentation will help you organize information in a good-looking way and compellingly present your ideas, easy to understand by your audience. A few examples of where you can apply this presentation template:
Try using those PowerPoint graphics to present your data visually in an elegant way.
All graphics are editable to modify the size, colors, and text. Also, you can extend the collection further with more PPT symbols (see Related Diagrams section).
Try using this set of fully editable PowerPoint vector shapes to present your data visually in an elegant way. You can easily modify all elements:
Your graphics add a nice touch to my presentations and I recently used them for one of my all-hands meetings. Your toolbox adds professionalism to my slides. Instead of using standard clipart.
Claude Jones, Director of Engineer, @Walmartlabs, USA
I needed a fresh look at some of my slides. I've tried to find a way to create a paintbrush effect, to underline, accentuate, add some color and the handwritten markers were just the things. Very easy to use, easy to size, change the color. It was an affordable, perfect solution and I'm happy to recommend it.
Anonymous, US
The crisp, clean look of the graphics, and the fact that it allowed me to easily edit and change the colors to match the template was my main reason for purchasing them.
Brandie Jenkins, E-learning Developer, USA


You may also need