Your graphics add a nice touch to my presentations and I recently used them for one of my all-hands meetings. Your toolbox adds professionalism to my slides. Instead of using standard clipart.
Claude Jones, Director of Engineer, @Walmartlabs, USA
Your graphics add a nice touch to my presentations and I recently used them for one of my all-hands meetings. Your toolbox adds professionalism to my slides. Instead of using standard clipart.
Claude Jones, Director of Engineer, @Walmartlabs, USA
I needed a fresh look at some of my slides. I've tried to find a way to create a paintbrush effect, to underline, accentuate, add some color and the handwritten markers were just the things. Very easy to use, easy to size, change the color. It was an affordable, perfect solution and I'm happy to recommend it.
Anonymous, US
The crisp, clean look of the graphics, and the fact that it allowed me to easily edit and change the colors to match the template was my main reason for purchasing them.
Brandie Jenkins, E-learning Developer, USA
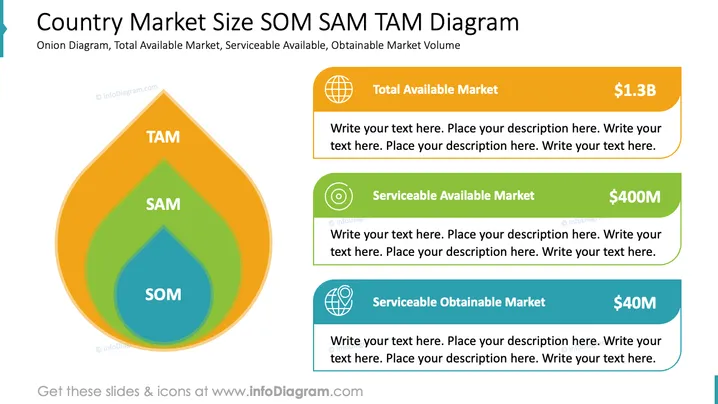
The slide illustrates the market size framework using an onion diagram. It explains three key concepts: Total Available Market (TAM) representing the overall demand for a product or service ($1.3B), Serviceable Available Market (SAM) depicting the segment of the TAM targeted by a company's products ($400M), and Serviceable Obtainable Market (SOM) indicating the portion of the SAM that can be captured realistically ($40M).
The slide employs a visually appealing color scheme and systematic design to effectively convey different market segments in a clear manner. The use of icons and numbered figures enhances the understanding of the complex market size framework.


