Your graphics add a nice touch to my presentations and I recently used them for one of my all-hands meetings. Your toolbox adds professionalism to my slides. Instead of using standard clipart.
Claude Jones, Director of Engineer, @Walmartlabs, USA
Your graphics add a nice touch to my presentations and I recently used them for one of my all-hands meetings. Your toolbox adds professionalism to my slides. Instead of using standard clipart.
Claude Jones, Director of Engineer, @Walmartlabs, USA
I needed a fresh look at some of my slides. I've tried to find a way to create a paintbrush effect, to underline, accentuate, add some color and the handwritten markers were just the things. Very easy to use, easy to size, change the color. It was an affordable, perfect solution and I'm happy to recommend it.
Anonymous, US
The crisp, clean look of the graphics, and the fact that it allowed me to easily edit and change the colors to match the template was my main reason for purchasing them.
Brandie Jenkins, E-learning Developer, USA
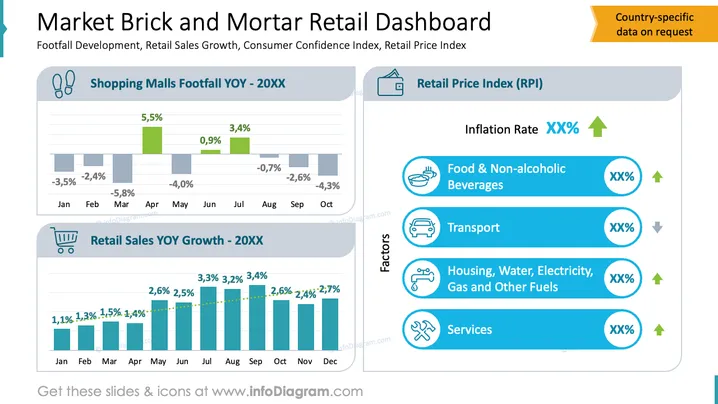
The slide presents a dashboard overview of brick-and-mortar retail metrics, including footfall development, retail sales growth, consumer confidence index, and retail price index. The "Shopping Malls Footfall YOY - 20XX" chart shows fluctuating monthly percentages, with a peak in April. "Retail Sales YOY Growth - 20XX" illustrates a steady increase in sales numbers from January to December. The "Retail Price Index (RPI)" emphasizes inflation rates across various sectors like Food & Beverages, Transport, and Services, with visual indicators suggesting trends.
The slide combines clear visual elements with essential data, creating an informative summary for decision-makers. The clean layout and intuitive icons enhance the understanding of complex retail metrics.


