
Cover and narrative setup


Deck preview
This template does not have a dedicated before/after case study, so we show the strongest slides from the actual deck instead.
Cover and narrative setup

Core structure and talking points
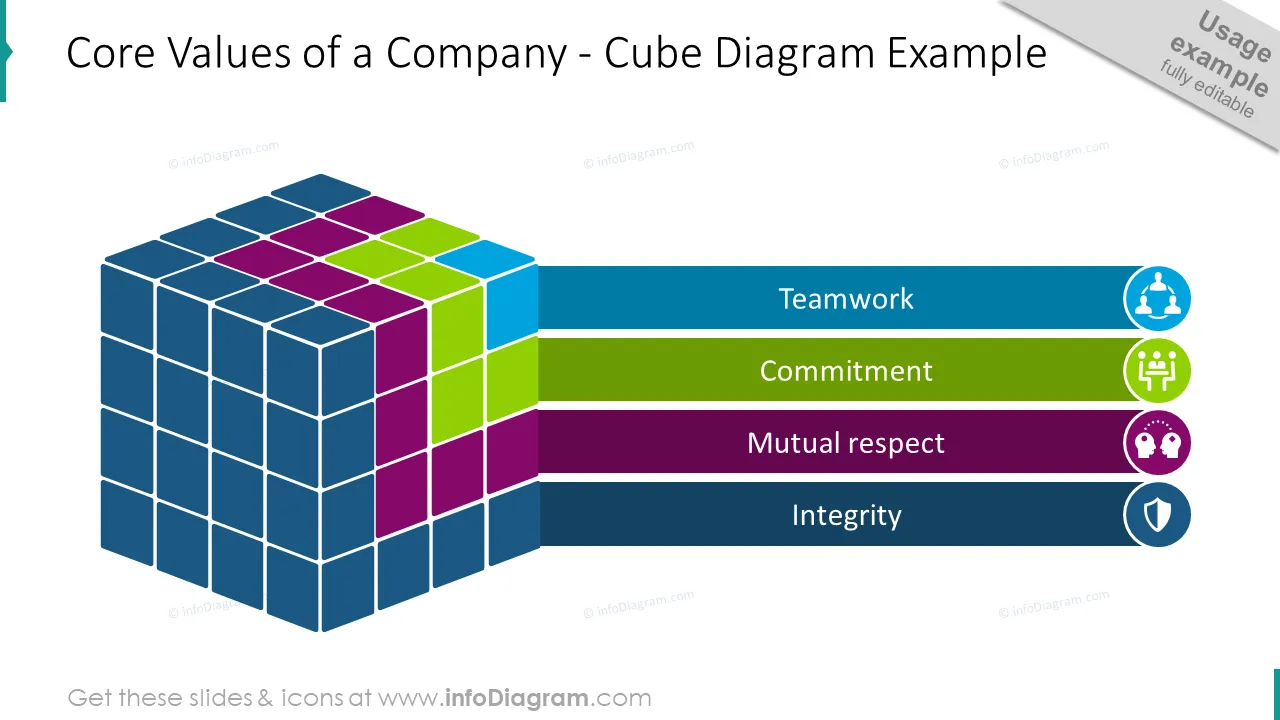
Polished visual slide from the deck
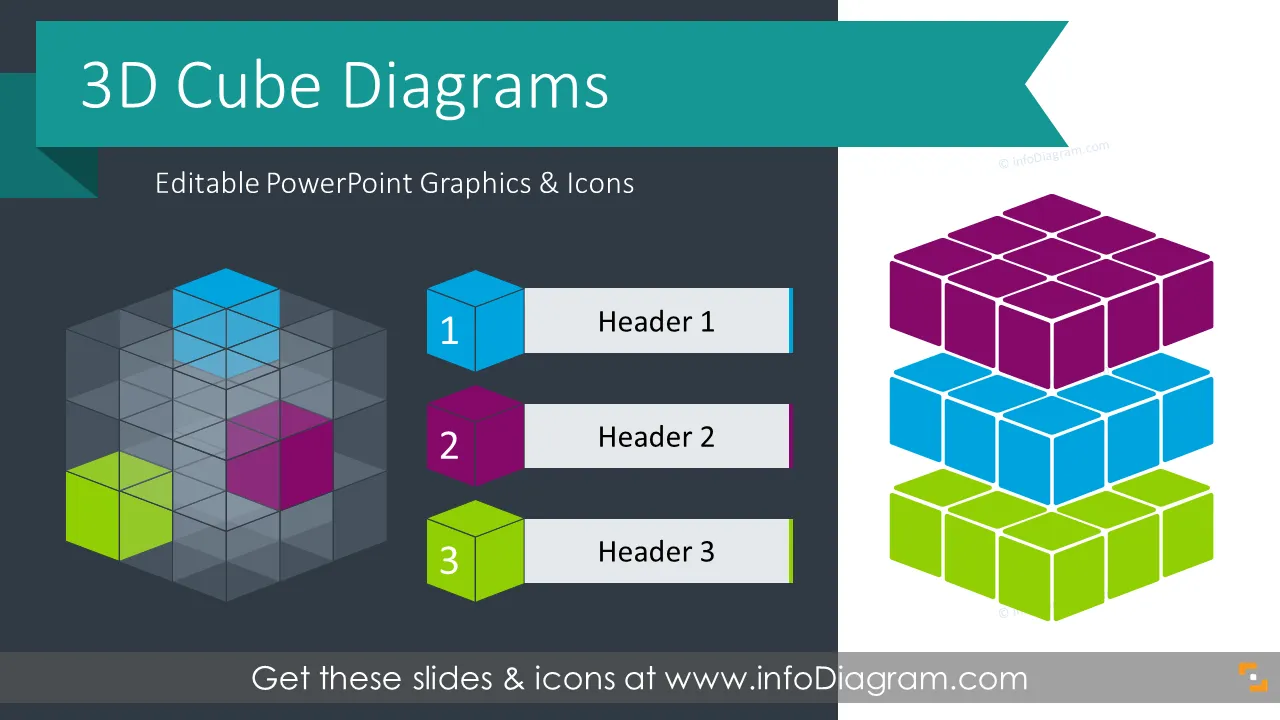
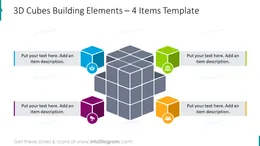
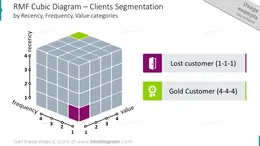
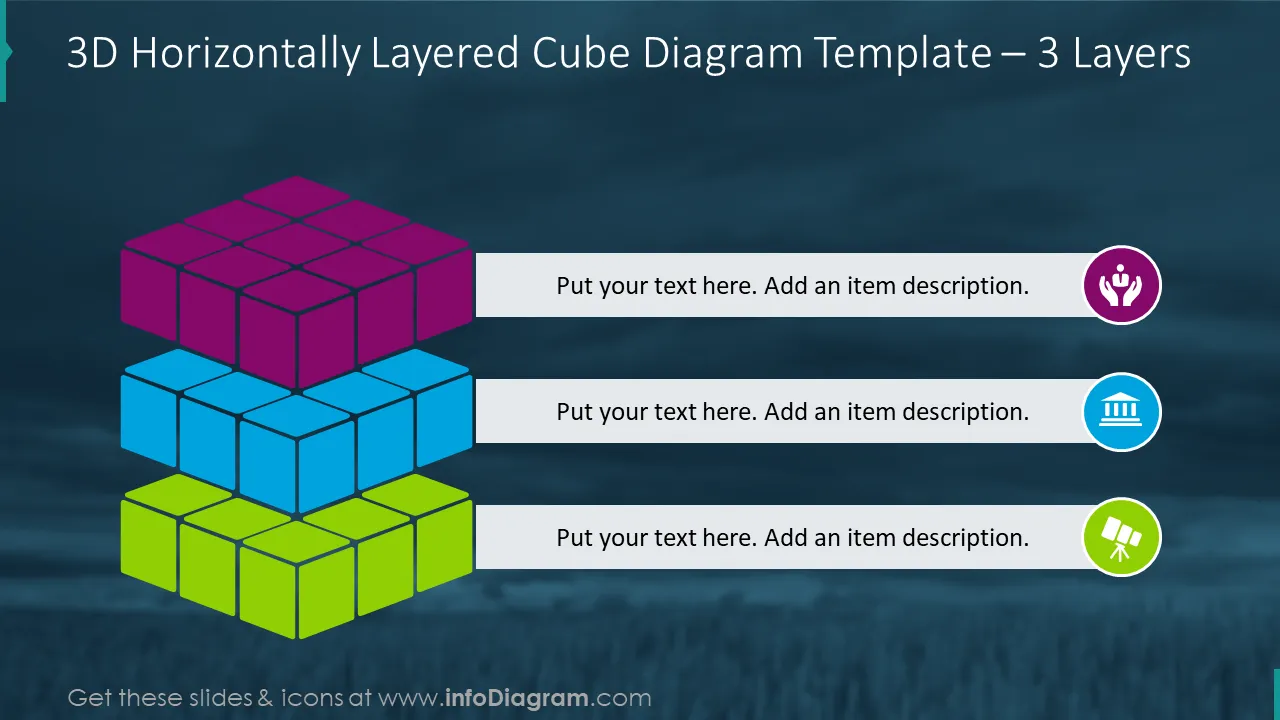
Well-known Rubik’s cube or 3D cube graphics are a handy visual to show complexity, order, and structure. Use it to present 3d spatial location, a business model with 3 categories such as RFM segmentation or OLAP data structure. We’ve designed several versions of 3D Cube graphics in several views, to help you enrich your presentation slides. All boxes are easy to modify. Feel free to adapt texts and shapes to your needs.
The 3D Cube Diagrams PowerPoint template contains:
Illustration of a cube object in 3d perspective is a good presentation visual to represent a multidimensional relationship of several categories. This structure can represent a system in order, a synergy of pieces creating a complete box, or the location of an abstract object in 3 dimensions.
Here are examples of where you can apply those cube diagrams:
3D Cube Diagrams contains ready-to-use slides:
Consider using those PowerPoint charts to replace text bullets in your slides.
All graphics are editable, so you can modify the colors and text. We added also a general icon collection at the end of the presentation deck. Optionally you can also extend the collection by more PPT symbols (see Related Diagrams section).
Photographs are included in the template. You can easily replace them as well with pictures of your own.
Fully editable in PowerPoint set of vector shapes fully editable by using built-in PowerPoint tools, including
See the editing demonstration in our HowTo Videos.
Your graphics add a nice touch to my presentations and I recently used them for one of my all-hands meetings. Your toolbox adds professionalism to my slides. Instead of using standard clipart.
Claude Jones, Director of Engineer, @Walmartlabs, USA
I needed a fresh look at some of my slides. I've tried to find a way to create a paintbrush effect, to underline, accentuate, add some color and the handwritten markers were just the things. Very easy to use, easy to size, change the color. It was an affordable, perfect solution and I'm happy to recommend it.
Anonymous, US
The crisp, clean look of the graphics, and the fact that it allowed me to easily edit and change the colors to match the template was my main reason for purchasing them.
Brandie Jenkins, E-learning Developer, USA


You may also need