

Your graphics add a nice touch to my presentations and I recently used them for one of my all-hands meetings. Your toolbox adds professionalism to my slides. Instead of using standard clipart.
Claude Jones, Director of Engineer, @Walmartlabs, USA

Before and after
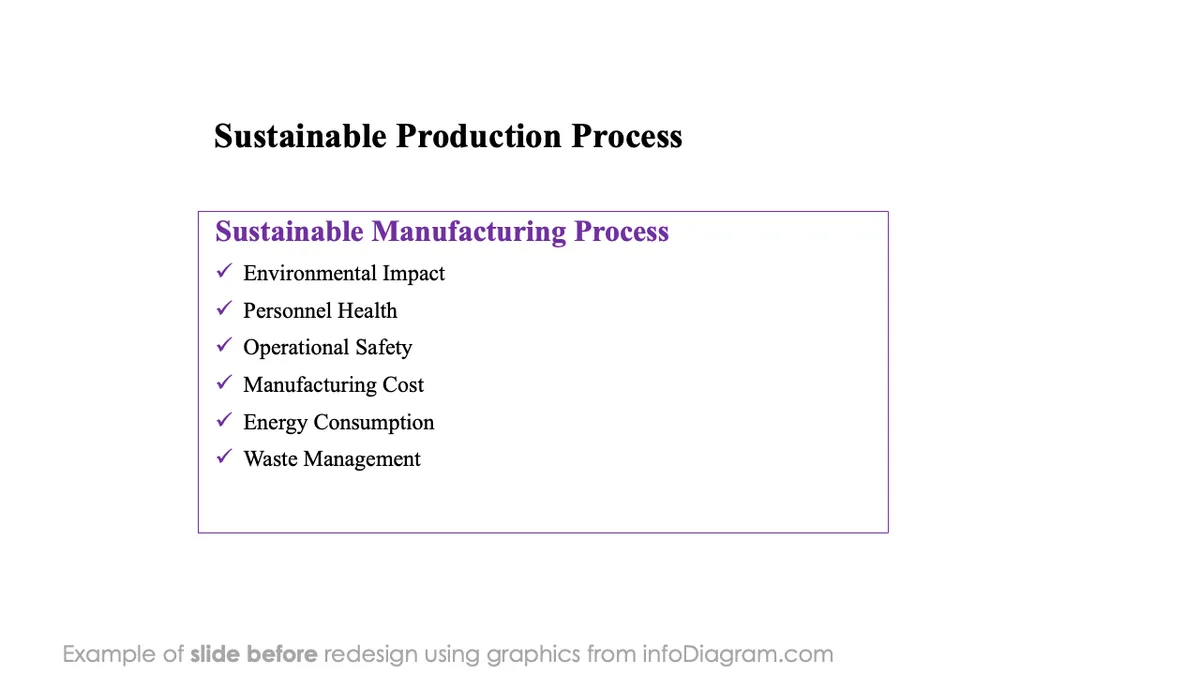
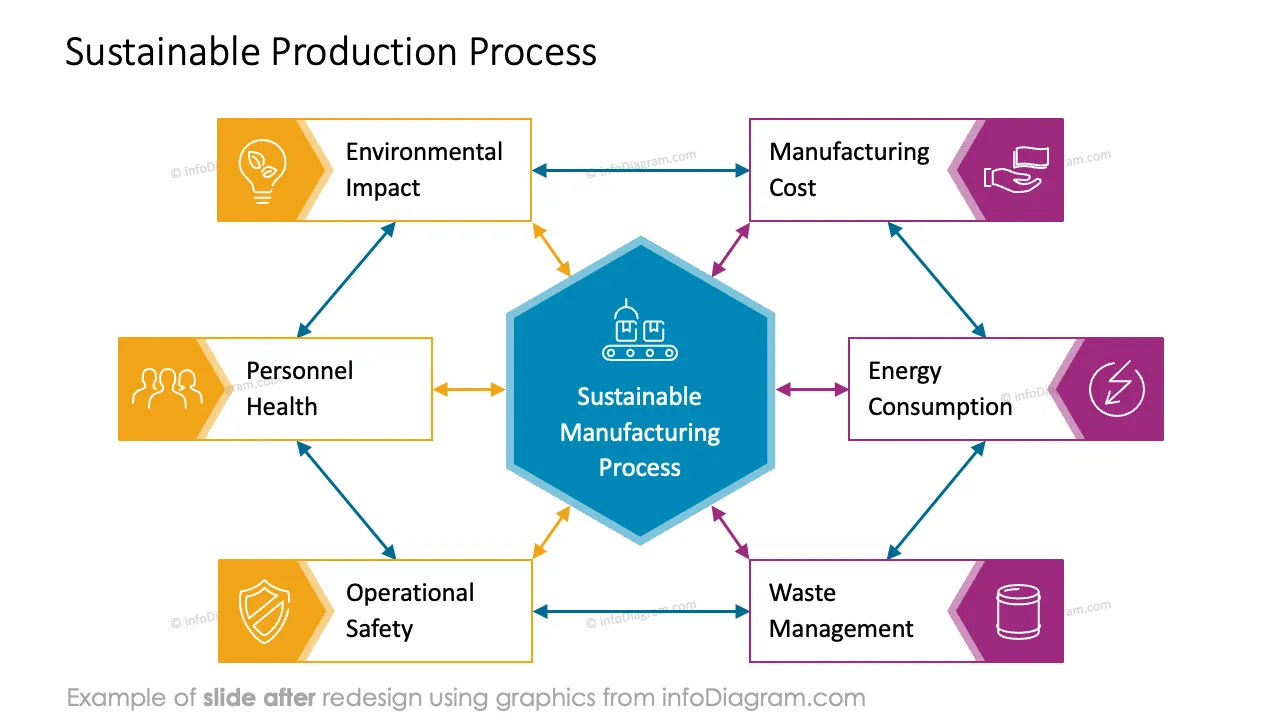
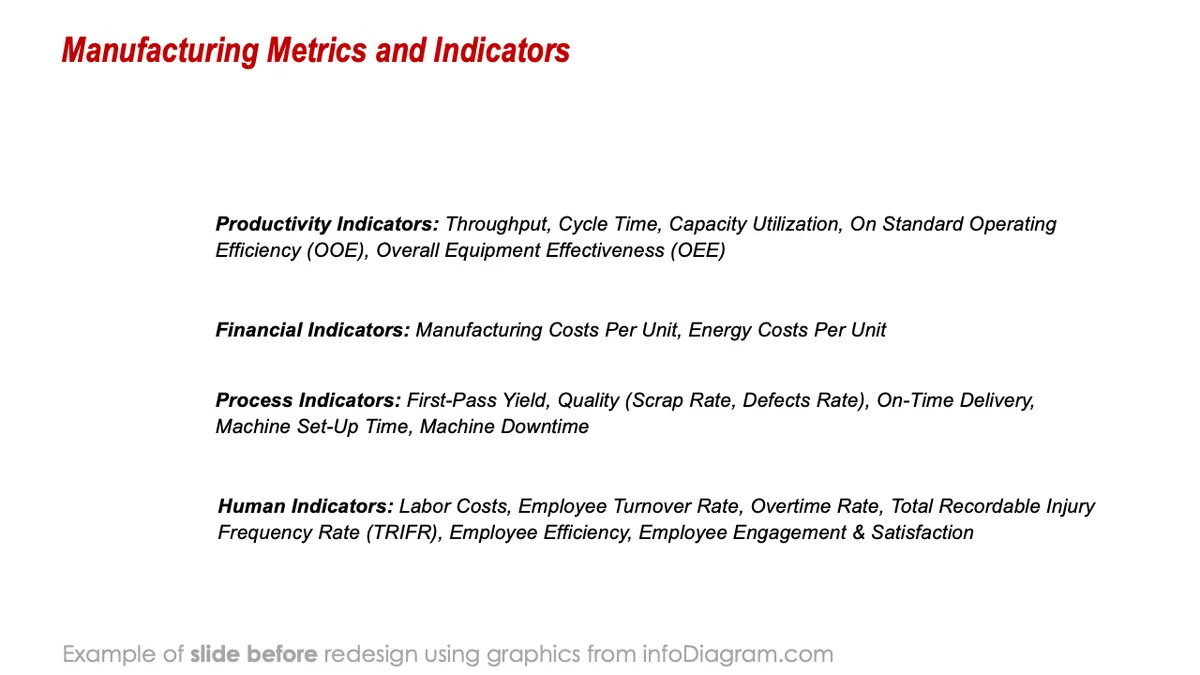
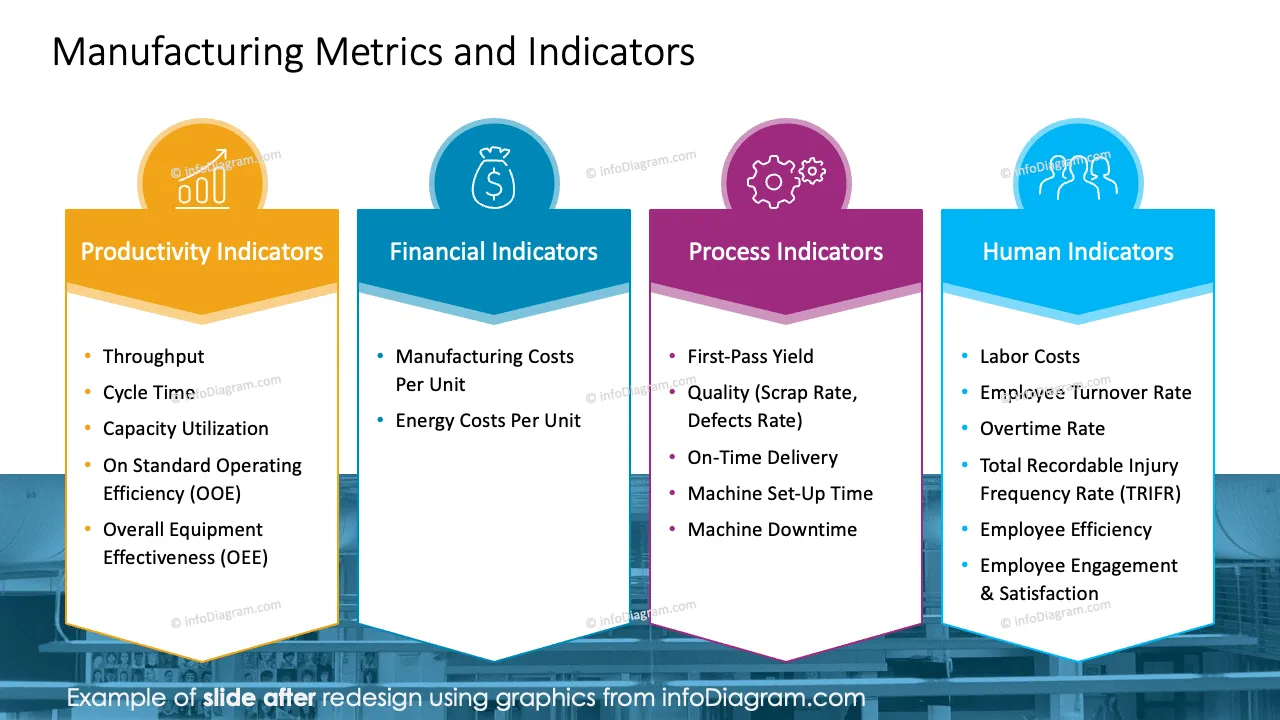
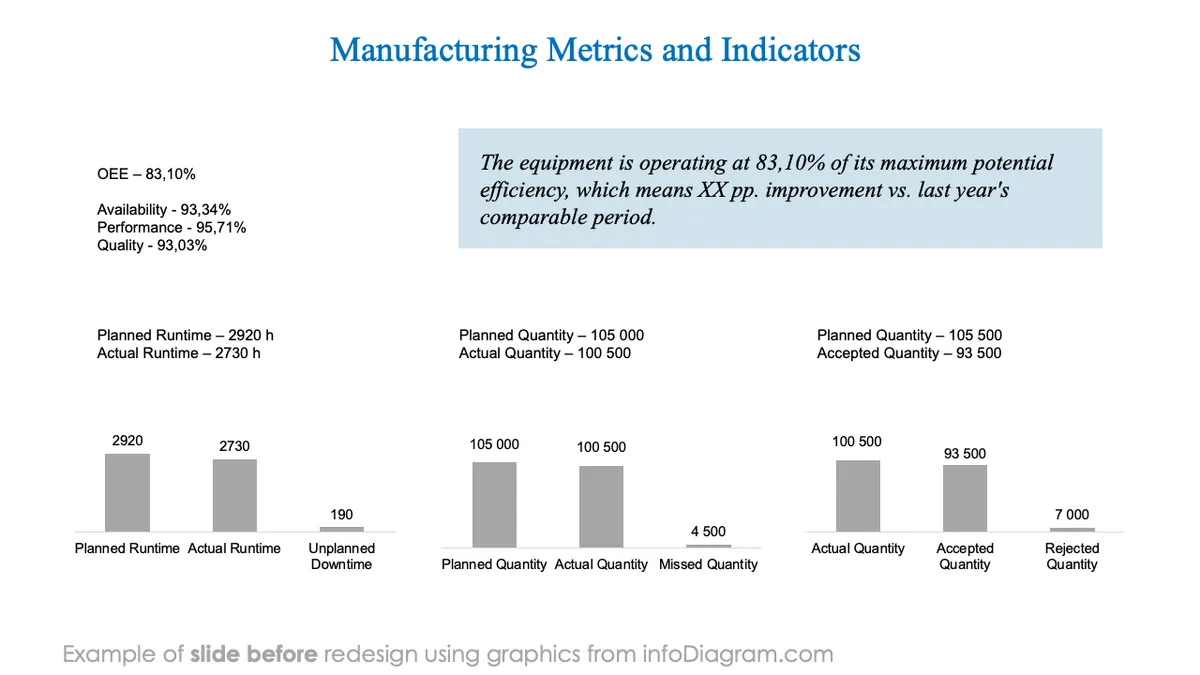
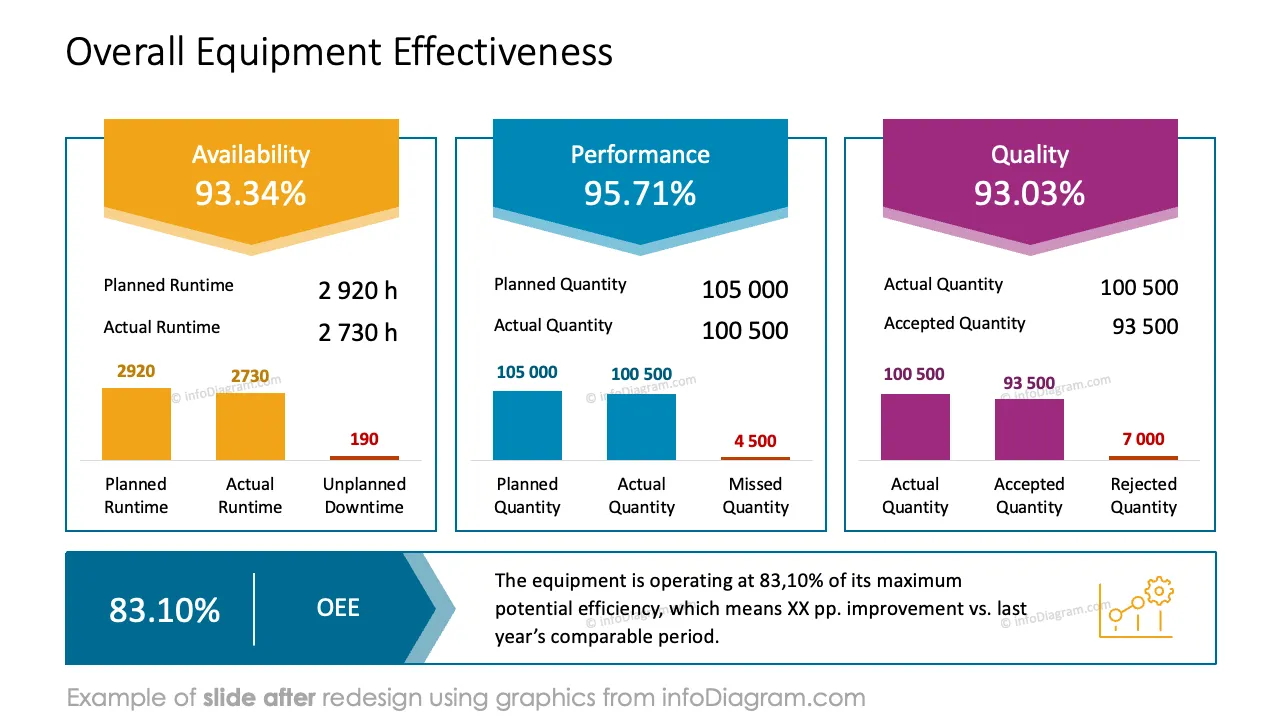
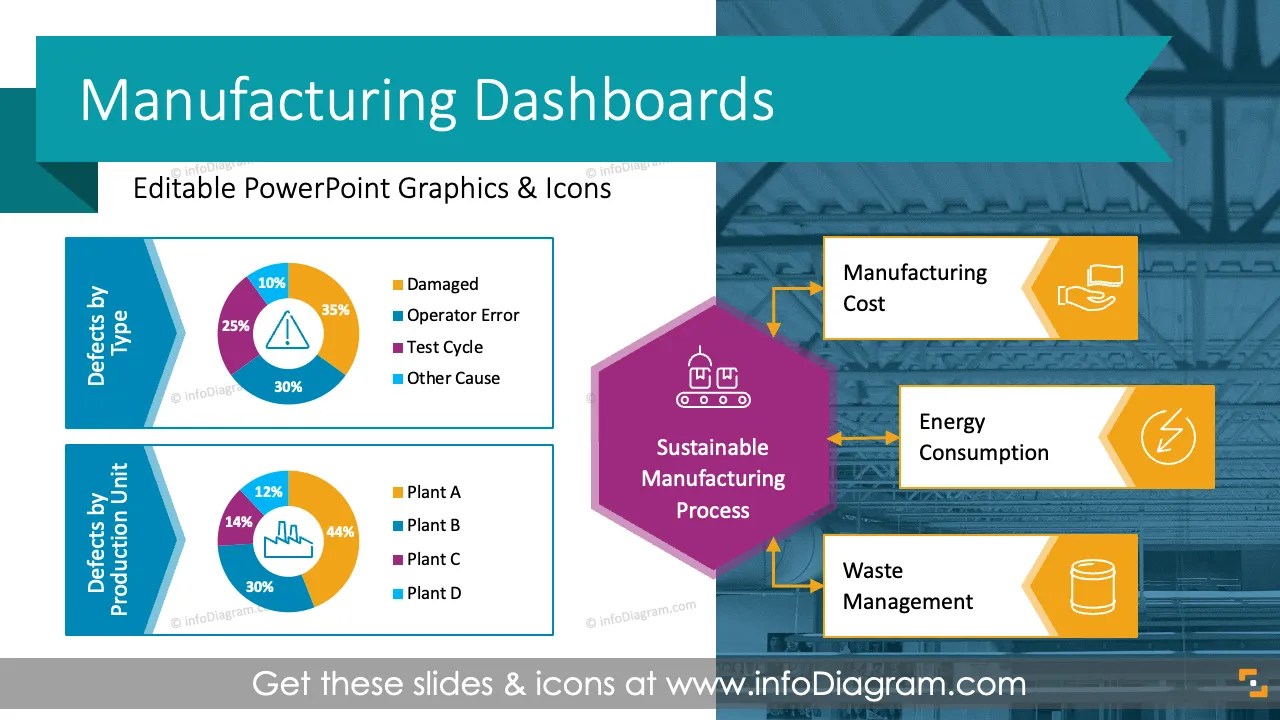
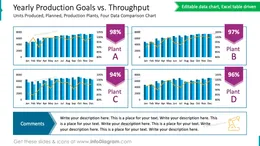
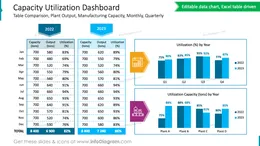
Do you need to provide a comprehensive overview of manufacturing performance to facilitate data-driven decisions for continuous efficiency improvement? Use our ready-content ppt to convey your metrics and comments in an attractive and eye-catching format.
This PowerPoint slide deck is designed in an elegant, flat style with colorful vector illustrations and outline icons. All graphic shapes can be recolored and resized without quality loss.
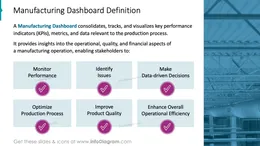
A manufacturing dashboard is a visual representation of key performance indicators (KPIs) and other relevant metrics that provide insights into the performance of manufacturing processes. It is a centralized tool for monitoring and analyzing critical data, enabling decision-makers to make informed choices to optimize operations. Manufacturing dashboards can be customized to meet the specific needs of different stakeholders within an organization.
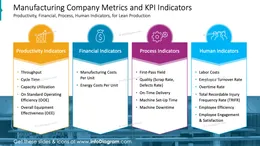
Key Performance Indicators (KPIs) in manufacturing are specific metrics used to measure the performance of various aspects of the manufacturing process. These indicators help organizations assess their efficiency, productivity, and success in achieving their operational and strategic goals.
Such presentations are complex, and it is, therefore, useful to present them in a simple visual form so that they can be understood by any audience, not necessarily production experts. The specific KPIs may vary based on the organization's goals, industry, and manufacturing processes.
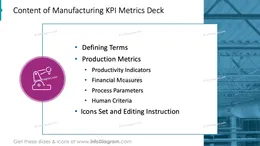
In the deck, we present some KPIs, which can be easily transformed into related metrics. Our slides are effortless to edit. We include detailed instructions on how to alter the content, values, colors, and look and feel of the charts, diagrams, or icons.
Manufacturing KPIs can be categorized into various groups based on the aspects of the manufacturing process they measure. Here are some specific areas and roles where manufacturing dashboards can be effectively utilized:
Try using those PowerPoint graphics to present your data visually in an elegant way.
All graphics are editable to modify the size, colors, and text. Also, you can extend the collection further with more PPT symbols (see Related Diagrams section).
Try using thisset of fully editable PowerPoint vector shapes to present your data visually in an elegant way. You can easily modify all elements:
Your graphics add a nice touch to my presentations and I recently used them for one of my all-hands meetings. Your toolbox adds professionalism to my slides. Instead of using standard clipart.
Claude Jones, Director of Engineer, @Walmartlabs, USA
I needed a fresh look at some of my slides. I've tried to find a way to create a paintbrush effect, to underline, accentuate, add some color and the handwritten markers were just the things. Very easy to use, easy to size, change the color. It was an affordable, perfect solution and I'm happy to recommend it.
Anonymous, US
The crisp, clean look of the graphics, and the fact that it allowed me to easily edit and change the colors to match the template was my main reason for purchasing them.
Brandie Jenkins, E-learning Developer, USA



You may also need