
Your graphics add a nice touch to my presentations and I recently used them for one of my all-hands meetings. Your toolbox adds professionalism to my slides. Instead of using standard clipart.
Claude Jones, Director of Engineer, @Walmartlabs, USA

Your graphics add a nice touch to my presentations and I recently used them for one of my all-hands meetings. Your toolbox adds professionalism to my slides. Instead of using standard clipart.
Claude Jones, Director of Engineer, @Walmartlabs, USA

I needed a fresh look at some of my slides. I've tried to find a way to create a paintbrush effect, to underline, accentuate, add some color and the handwritten markers were just the things. Very easy to use, easy to size, change the color. It was an affordable, perfect solution and I'm happy to recommend it.
Anonymous, US
The crisp, clean look of the graphics, and the fact that it allowed me to easily edit and change the colors to match the template was my main reason for purchasing them.
Brandie Jenkins, E-learning Developer, USA
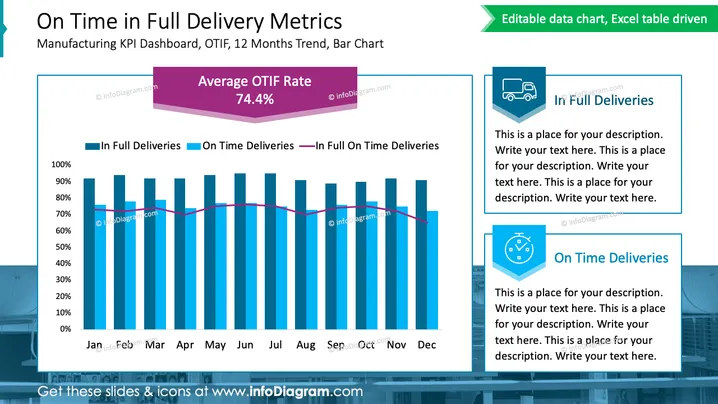
This PowerPoint slide, titled "On Time in Full Delivery Metrics," presents a KPI dashboard for tracking OTIF (On Time in Full) over a 12-month trend with a bar chart. It features three key data points: "In Full Deliveries," "On Time Deliveries," and "In Full On Time Deliveries." "In Full Deliveries" refers to orders that are delivered with all items as requested. "On Time Deliveries" represents orders that are delivered by the agreed-upon date. "In Full On Time Deliveries" combines both aspects, indicating orders that are complete and timely. The slide also reports an "Average OTIF Rate" at 74.4%.
The slide is designed with a professional and clean visual, focusing on the clarity of data presentation. The use of color distinguishes different metrics, and icons are employed to visually represent the delivery concepts.


