

Your graphics add a nice touch to my presentations and I recently used them for one of my all-hands meetings. Your toolbox adds professionalism to my slides. Instead of using standard clipart.
Claude Jones, Director of Engineer, @Walmartlabs, USA

Your graphics add a nice touch to my presentations and I recently used them for one of my all-hands meetings. Your toolbox adds professionalism to my slides. Instead of using standard clipart.
Claude Jones, Director of Engineer, @Walmartlabs, USA
I needed a fresh look at some of my slides. I've tried to find a way to create a paintbrush effect, to underline, accentuate, add some color and the handwritten markers were just the things. Very easy to use, easy to size, change the color. It was an affordable, perfect solution and I'm happy to recommend it.
Anonymous, US
The crisp, clean look of the graphics, and the fact that it allowed me to easily edit and change the colors to match the template was my main reason for purchasing them.
Brandie Jenkins, E-learning Developer, USA
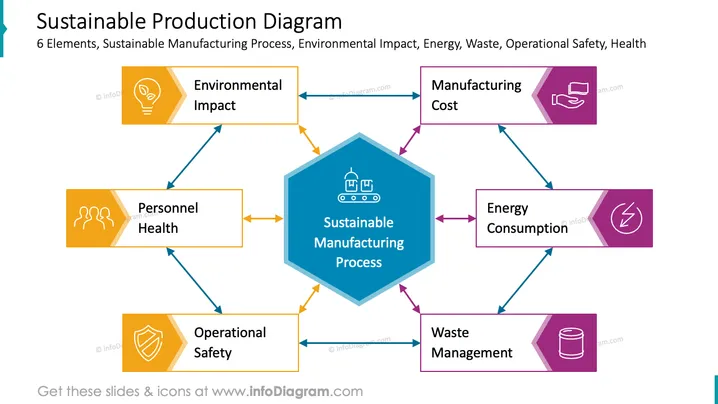
The PowerPoint slide presents a "Sustainable Production Diagram" that outlines six key factors influencing sustainable manufacturing: Environmental Impact, Manufacturing Cost, Energy Consumption, Waste Management, Operational Safety, and Personnel Health. Environmental Impact denotes the effects of manufacturing on natural ecosystems. Manufacturing Cost covers the expenses involved in production. Energy Consumption measures the amount of energy required for manufacturing. Waste Management addresses how byproducts and waste are handled. Operational Safety pertains to the protocols ensuring safe operation conditions. Personnel Health emphasizes the importance of maintaining the health and well-being of the workforce.
The slide has a clean, professional appearance with a clear visual hierarchy. Icons and colors are strategically used to differentiate each sustainability factor and guide the viewer's eye through the diagram.



