
Your graphics add a nice touch to my presentations and I recently used them for one of my all-hands meetings. Your toolbox adds professionalism to my slides. Instead of using standard clipart.
Claude Jones, Director of Engineer, @Walmartlabs, USA
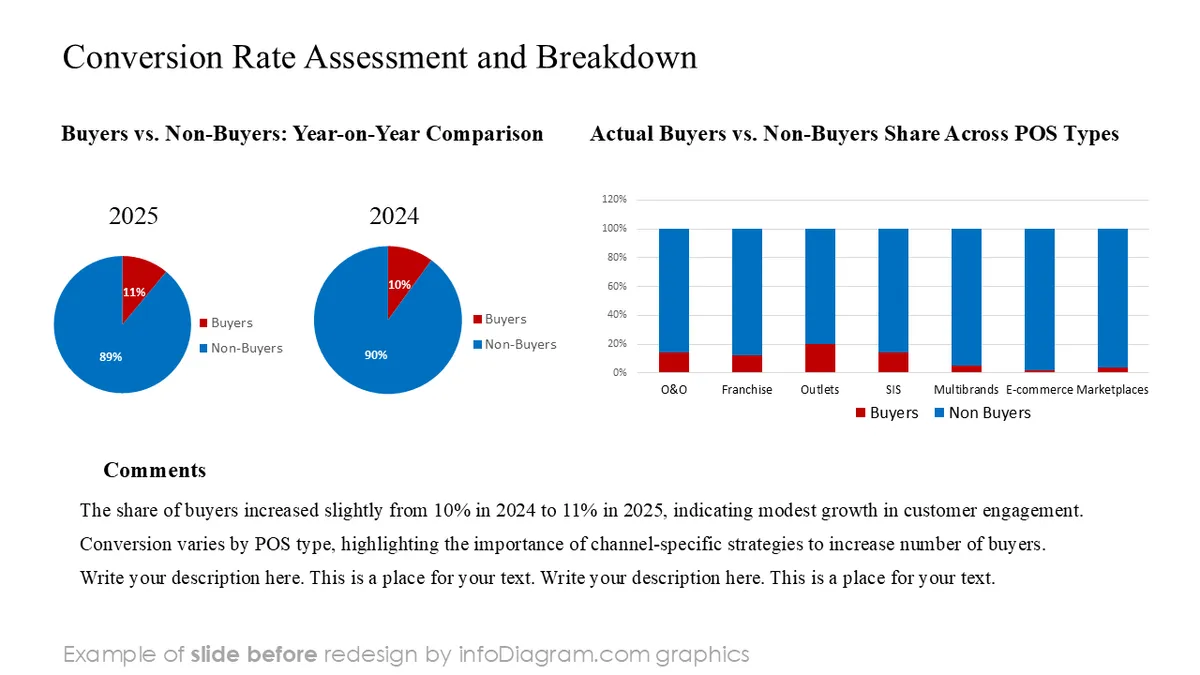
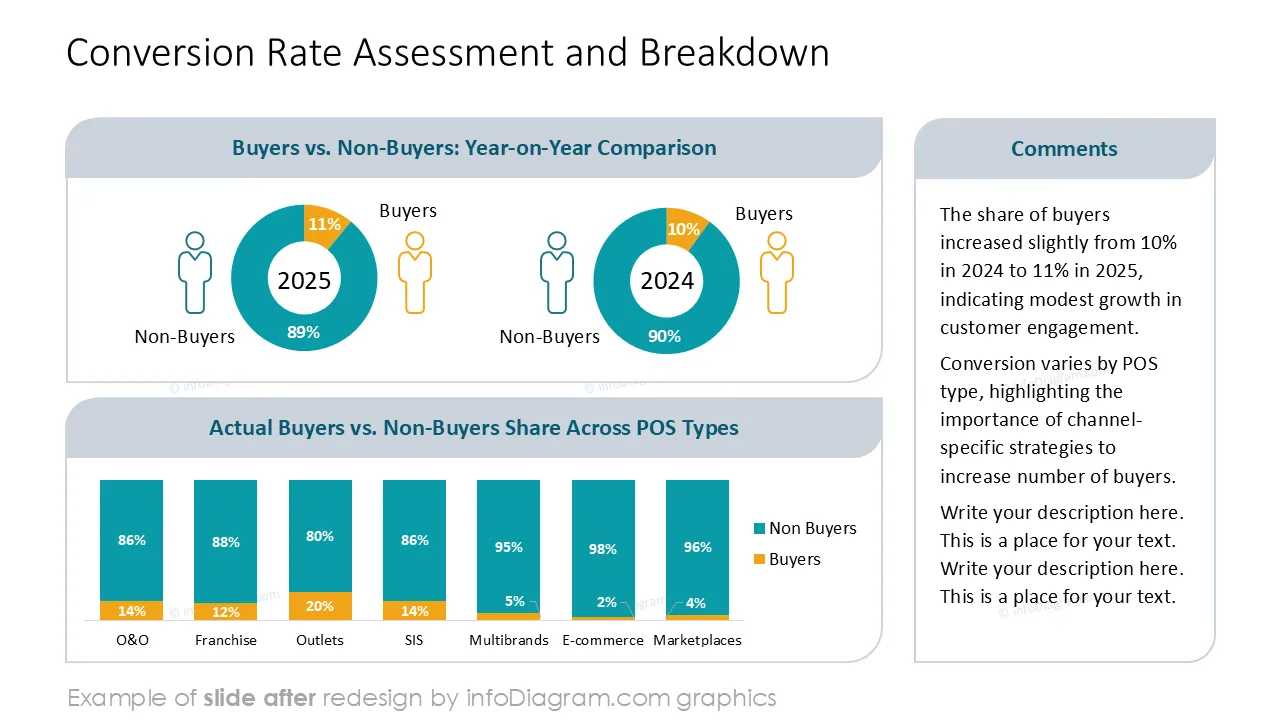
Before and after
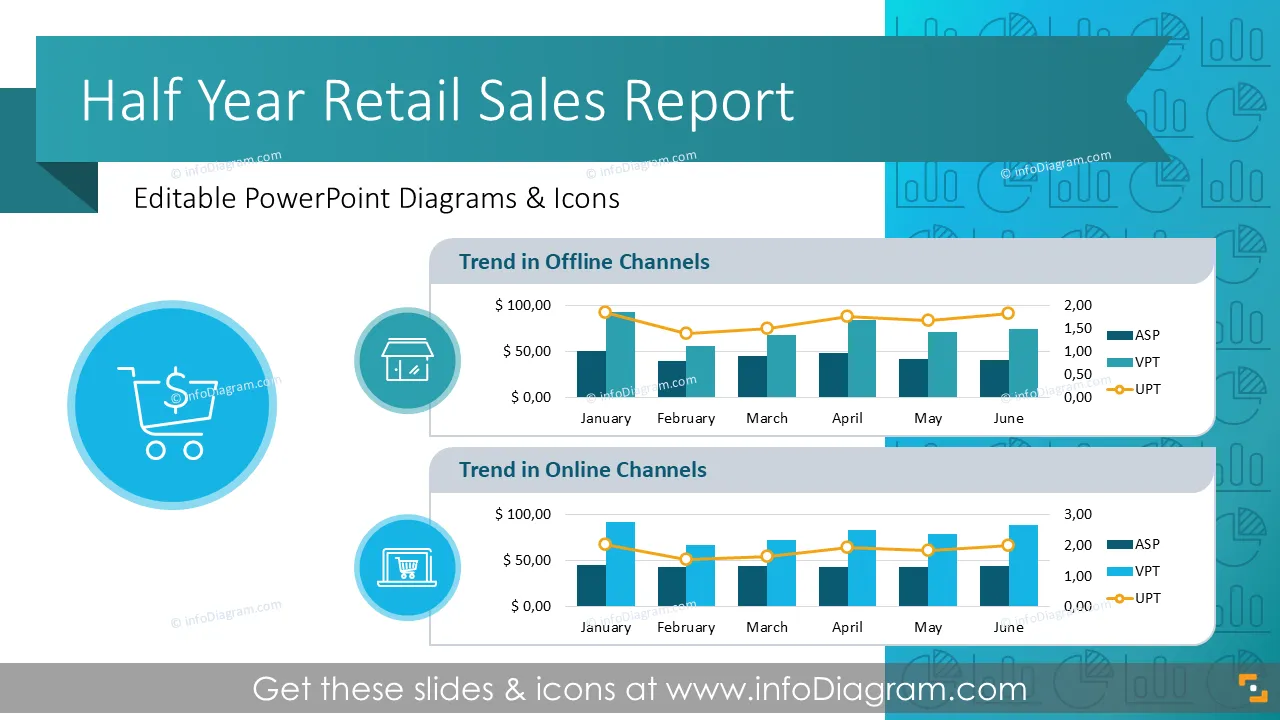
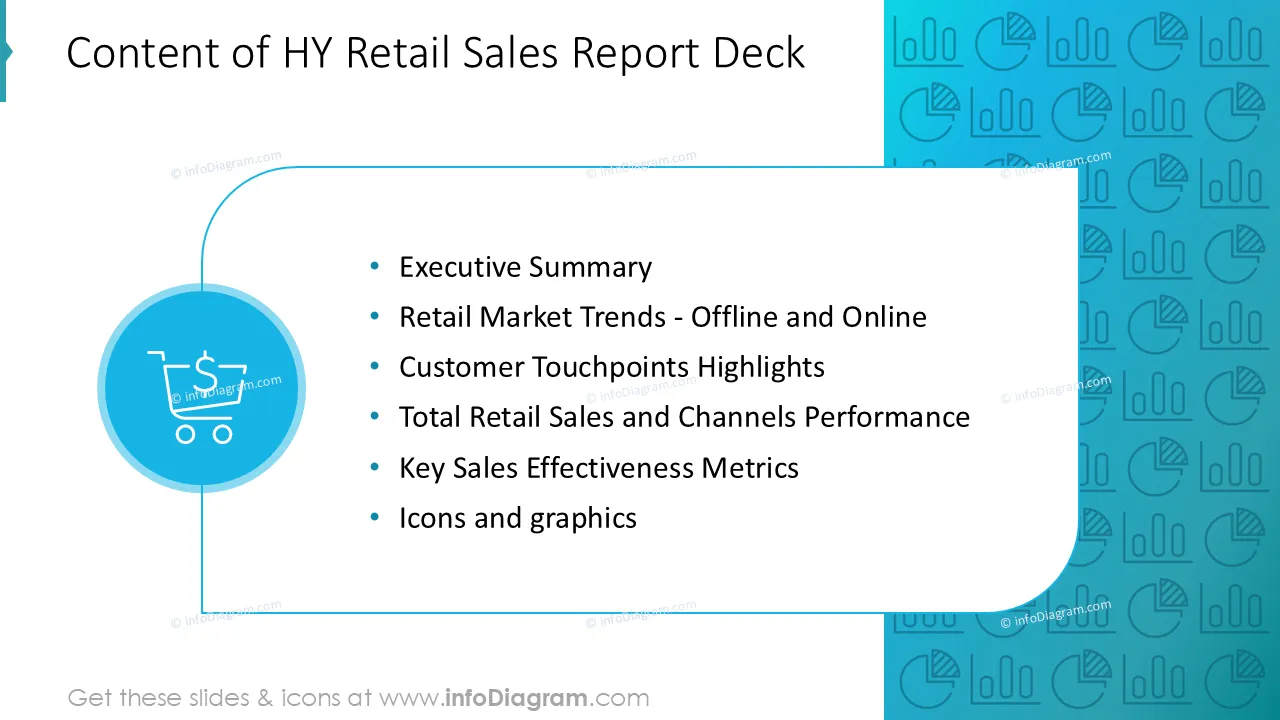
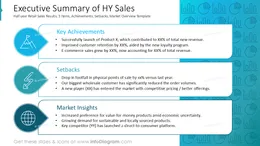
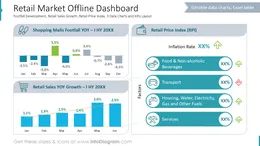
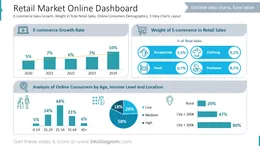
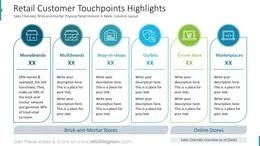
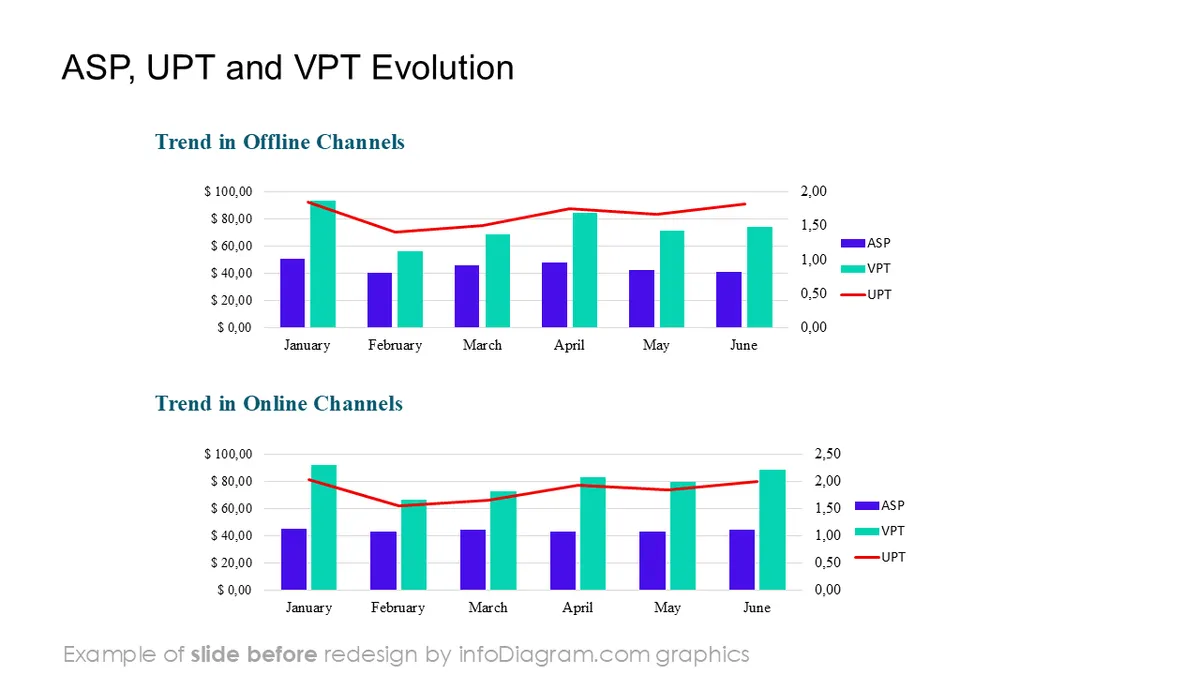
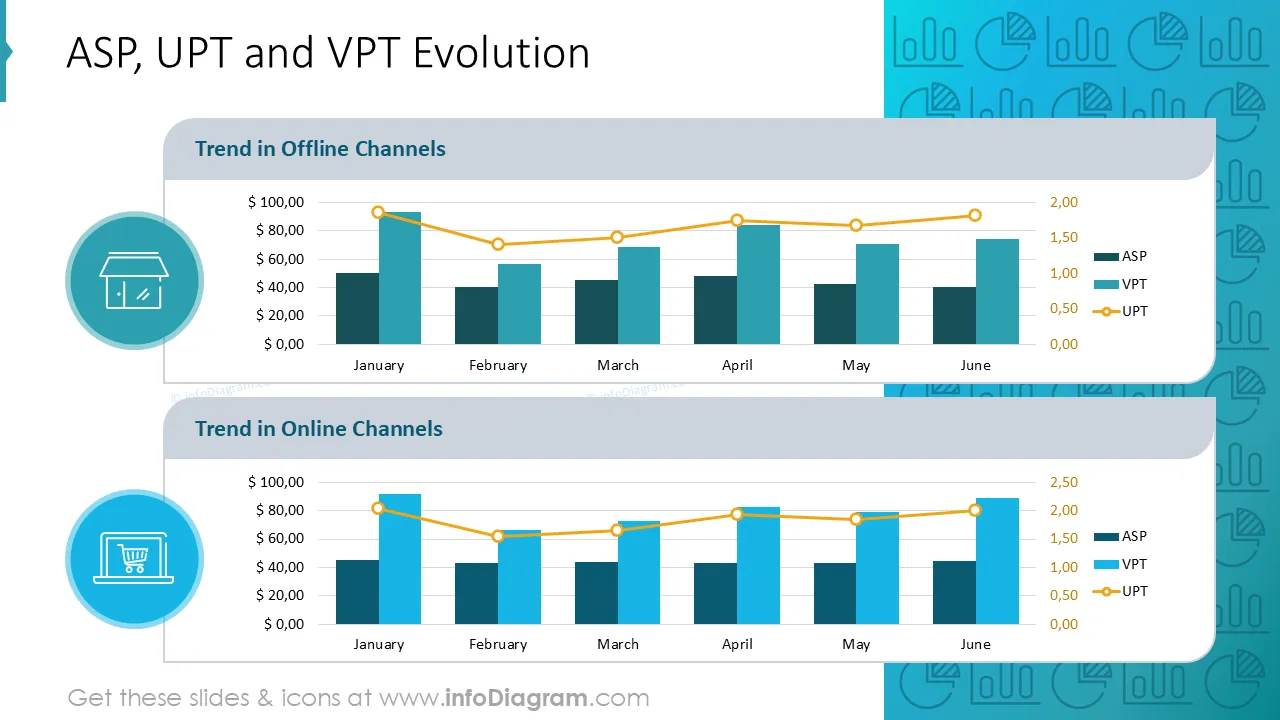
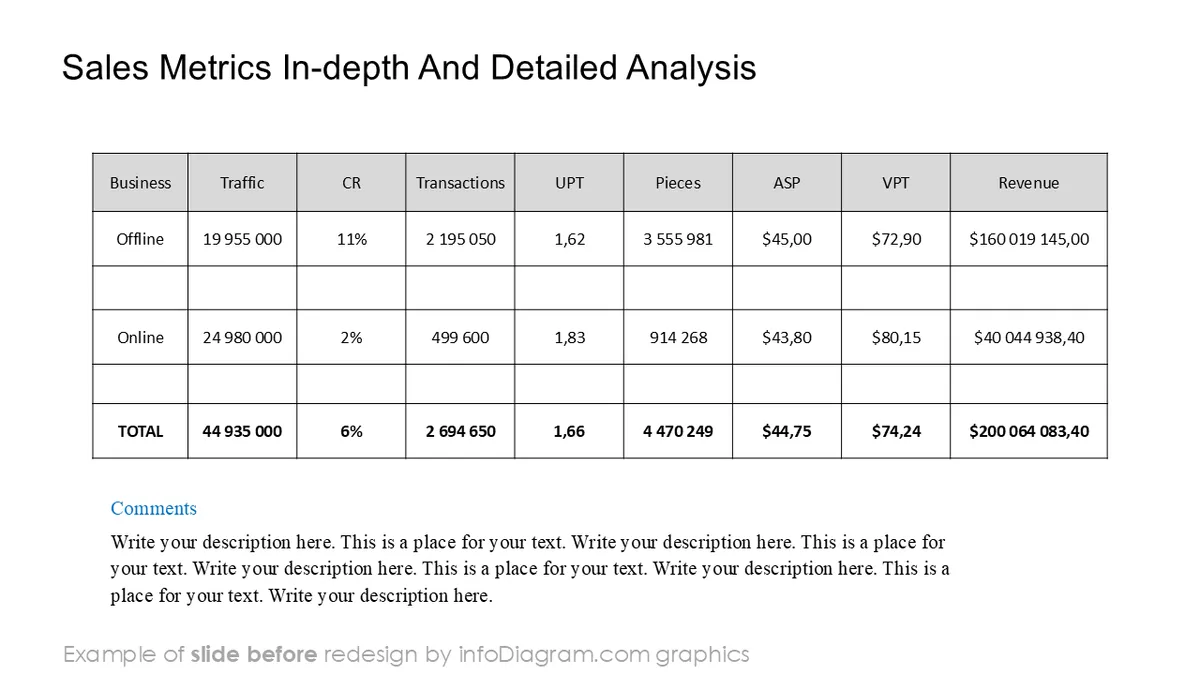
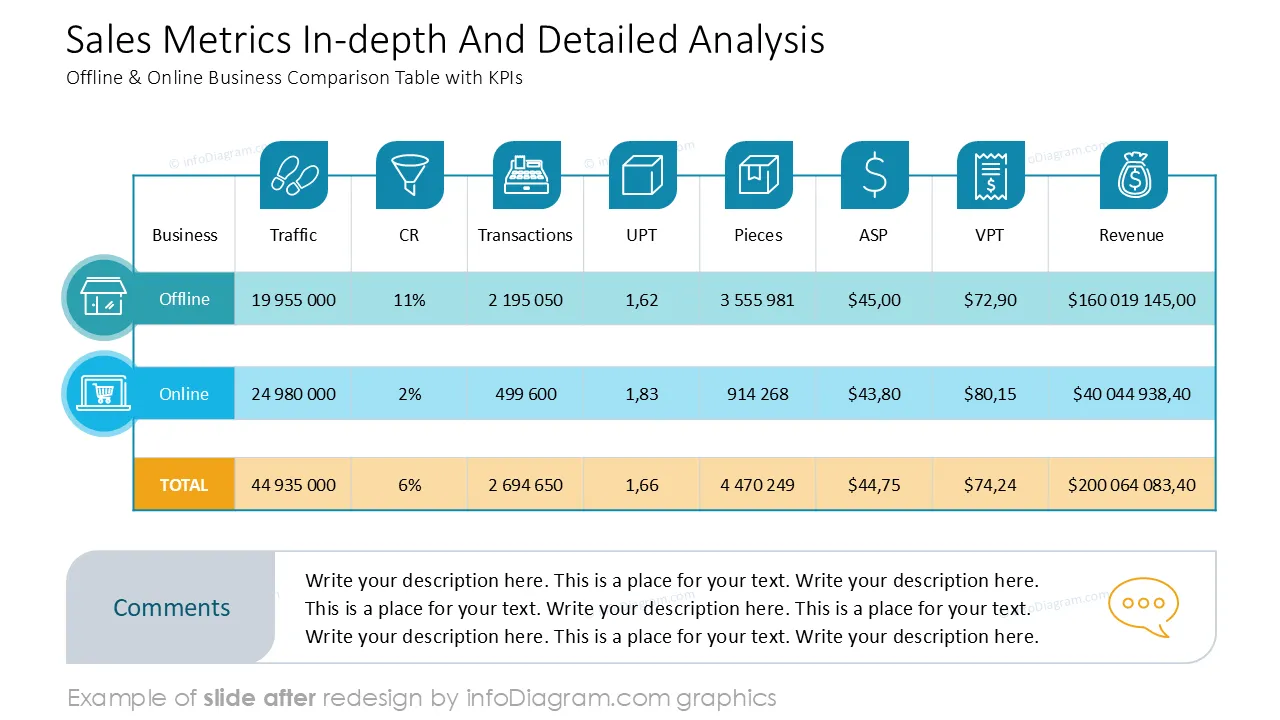
Need to present retail sales report over the last 6 months? Show your retail data in an attractive format, Get advantage of this pre-designed report template. Modify slides, replace your numbers and your explanations.
This PowerPoint slide deck is designed in an elegant flat style with colorful vector illustrations and outline icons. All graphic shapes can be recolored and resized without quality loss.
Retail data becomes far more impactful when visualized clearly. Using a professionally designed PowerPoint template allows you to turn raw numbers into easy-to-read charts, dashboards, and tables. It helps you to tell story behind those retail data. Your audience can grasp key trends at a glance. And your presentation will look more polished and executive-ready.
This PowerPoint template is useful in a variety of business settings, including:
Such a presentation can be used by retail managers, analysts, and sales leads. It helps you present your half-year results in a professional and visually compelling way.
All graphics are editable to modify the size, colors, and text. Also, you can extend the collection further with more PPT symbols (see Related Diagrams section).
L4L – Like-for-Like Measures sales growth in stores open for a year or more, excluding new or closed ones. ASP – Average Selling Price The average price at which a product or category is sold over a specific period. UPT – Units Per Transaction The average number of items sold per customer transaction. VPT – Value Per Transaction The average total value of a single customer transaction. CR – Conversion Rate The percentage of visitors who make a purchase compared to total store or website traffic. O &O – Owned & Operated Refers to stores or e-commerce platforms that are directly managed by the retailer. SIS – Store-in-Store A retail setup where a brand operates a dedicated space within another retailer's store. HY – Half Year Refers to the first or second six months of a financial or calendar year. H1 – First Half (of Year) The period covering January–June (or first six months of fiscal year). H2 – Second Half (of Year) The period covering July–December (or last six months of fiscal year). LY – Last Year Used to compare performance or metrics from the same period in the previous year. KPI – Key Performance Indicator A measurable value that indicates how effectively a company is achieving its objectives. DTC – Direct-to-Consumer A sales model where brands sell directly to customers, bypassing third-party retailers.
Your graphics add a nice touch to my presentations and I recently used them for one of my all-hands meetings. Your toolbox adds professionalism to my slides. Instead of using standard clipart.
Claude Jones, Director of Engineer, @Walmartlabs, USA
I needed a fresh look at some of my slides. I've tried to find a way to create a paintbrush effect, to underline, accentuate, add some color and the handwritten markers were just the things. Very easy to use, easy to size, change the color. It was an affordable, perfect solution and I'm happy to recommend it.
Anonymous, US
The crisp, clean look of the graphics, and the fact that it allowed me to easily edit and change the colors to match the template was my main reason for purchasing them.
Brandie Jenkins, E-learning Developer, USA


You may also need


