Your graphics add a nice touch to my presentations and I recently used them for one of my all-hands meetings. Your toolbox adds professionalism to my slides. Instead of using standard clipart.
Claude Jones, Director of Engineer, @Walmartlabs, USA
Your graphics add a nice touch to my presentations and I recently used them for one of my all-hands meetings. Your toolbox adds professionalism to my slides. Instead of using standard clipart.
Claude Jones, Director of Engineer, @Walmartlabs, USA
I needed a fresh look at some of my slides. I've tried to find a way to create a paintbrush effect, to underline, accentuate, add some color and the handwritten markers were just the things. Very easy to use, easy to size, change the color. It was an affordable, perfect solution and I'm happy to recommend it.
Anonymous, US
The crisp, clean look of the graphics, and the fact that it allowed me to easily edit and change the colors to match the template was my main reason for purchasing them.
Brandie Jenkins, E-learning Developer, USA
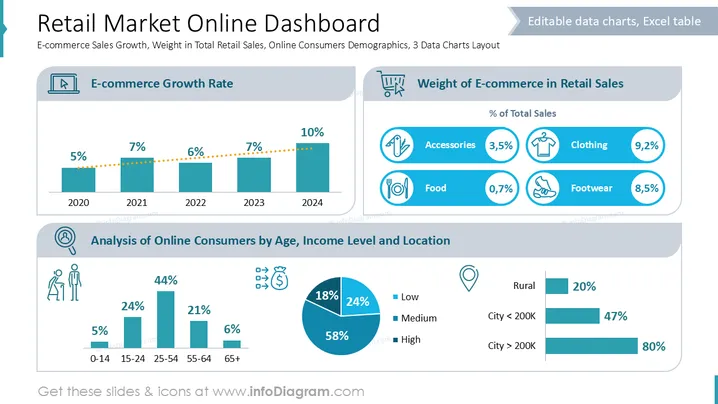
The slide presents an overview of the retail market with a focus on e-commerce. It includes information about the growth rate of e-commerce from 2020 to 2024, showing an upward trend from 5% to 10%. The weight of e-commerce in retail sales is detailed, with clothing accounting for 9.2% of total sales, followed by footwear at 8.5%. Accessories and food constitute smaller percentages. Additionally, an analysis of online consumers by demographics shows that most are aged 25-54. Income levels are predominantly medium (58%), and a majority of consumers, 80%, come from cities with populations over 200K.
The overall composition is structured neatly into sections, using icons effectively for quick visual reference. The combination of charts aids in delivering a concise analysis.


