Your graphics add a nice touch to my presentations and I recently used them for one of my all-hands meetings. Your toolbox adds professionalism to my slides. Instead of using standard clipart.
Claude Jones, Director of Engineer, @Walmartlabs, USA
Your graphics add a nice touch to my presentations and I recently used them for one of my all-hands meetings. Your toolbox adds professionalism to my slides. Instead of using standard clipart.
Claude Jones, Director of Engineer, @Walmartlabs, USA
I needed a fresh look at some of my slides. I've tried to find a way to create a paintbrush effect, to underline, accentuate, add some color and the handwritten markers were just the things. Very easy to use, easy to size, change the color. It was an affordable, perfect solution and I'm happy to recommend it.
Anonymous, US
The crisp, clean look of the graphics, and the fact that it allowed me to easily edit and change the colors to match the template was my main reason for purchasing them.
Brandie Jenkins, E-learning Developer, USA
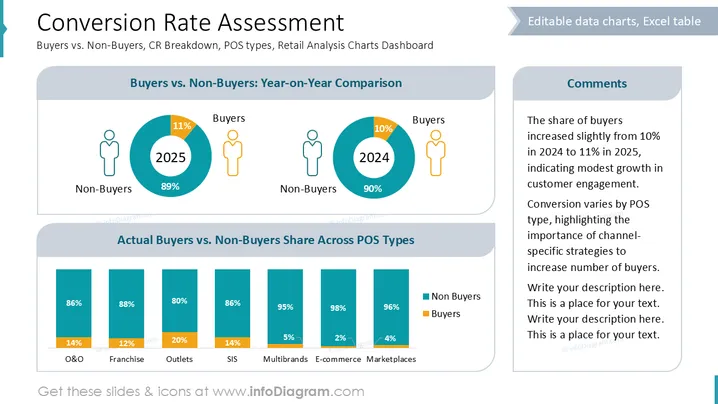
The slide evaluates conversion rates between buyers and non-buyers, comparing year-on-year data. It highlights slight growth in buyer share from 10% in 2024 to 11% in 2025, suggesting an increase in customer engagement. The second chart examines conversion across various POS types such as O&O, Franchise, and E-commerce, showing the diversity in conversion rates, emphasizing the need for tailored strategies to boost conversion.
The slide uses clear, contrasting colors for easy readability and understanding. It effectively communicates information using well-organized charts and comments.


