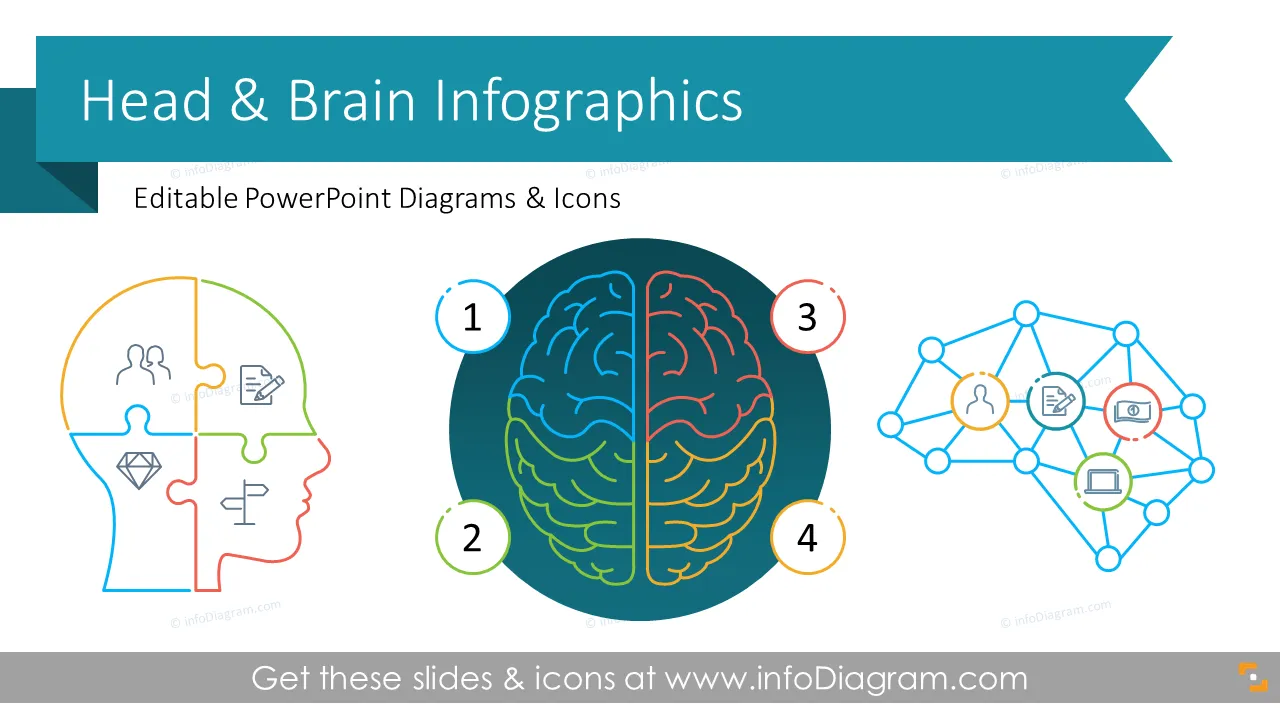
Giving a presentation about creative thinking, analytical thinking qualities, or a mind map is easier with head and brain diagrams. Use the human brain infographics or the head shape diagrams as a metaphor to represent segments, lists, or levels. We have designed a PowerPoint template with a collection of universal human head and brain outline graphics to help you show information visually instead of blocks of text.
The Brain and Head Diagrams contain slides with:
- 20 infographic slides including head outline shapes for presenting steps and levels, synergy, and areas.
- This slide collection is designed in a modern outline style. Infographic templates will help you find the proper way to effectively project your thought process and create unique slides without using too much information.
- 24 Outline icons to convey topics connected with business and creativity, e.g. Goal, Search, Money, Analysis, Choice, Processes, Cooperation, People, Value, Idea, Innovation, Strategic Thinking, and more.
- Instructions on how to modify those diagrams using standard PowerPoint editing tools.
Format: Fully editable vector shapes and fonts. (You can recolor infographics, diagrams, and icons. It's also possible to resize elements without quality loss).
What are Head and Brain Diagrams?
Head and brain diagrams are a collection of visual elements using the human head and brain as a metaphor to illustrate topics related to the mind, creativity, or various thinking processes. It's recommended to utilize graphical elements for public speaking because presenting information with visuals is much more comprehensive than bullet-point text. It's also more effective to replace text items with graphical diagrams that will illustrate all of your points. The outline infographic style is subtle and will complement your message without overshadowing it.
How to Use The Head and Brain Diagrams?
The template is easy to edit. So, after you buy this template, you can immediately download and change the text according to your needs. You can edit your presentation using Microsoft PowerPoint, Google Slides, or other presentation software. Copy and paste the contents using shortcuts or dragging the PowerPoint template to adapt it to your presentation topic. The slides and visuals are professionally designed and the content is very easy to customize. If you have creative ideas and want a unique look, play around with the elements and make the design your own with a personal touch!
Where can you use the human head and brain diagrams?
You can utilize the head and brain shapes template to visualize a multitude of different topics including brain functions, brain anatomy, major parts and areas of the brain, brain health, symptoms of a brain condition, or psychological topics involving different types of thinking:
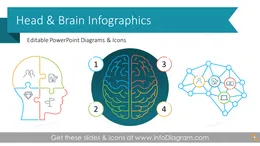
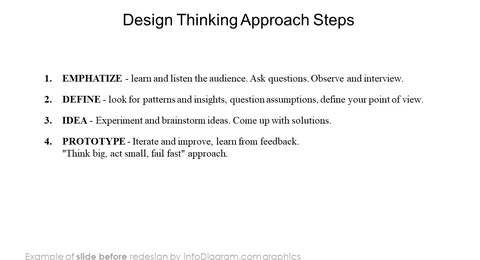
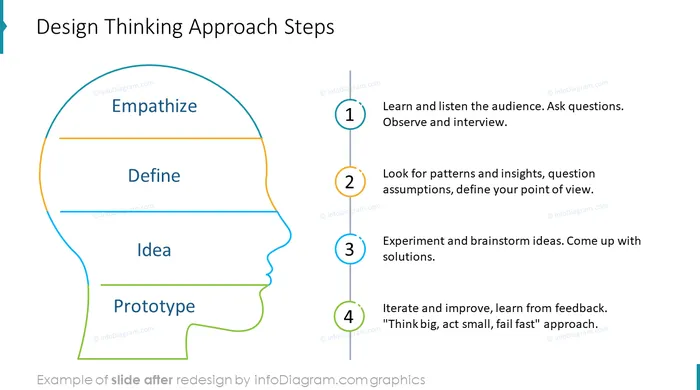
- Present steps of the design thinking approach.
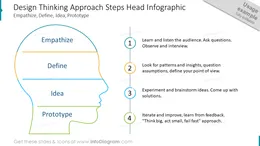
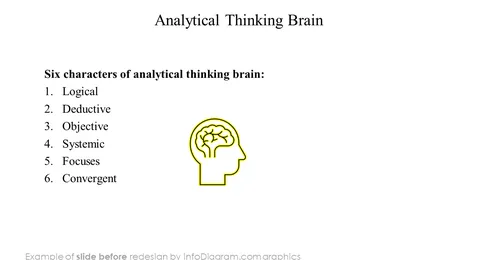
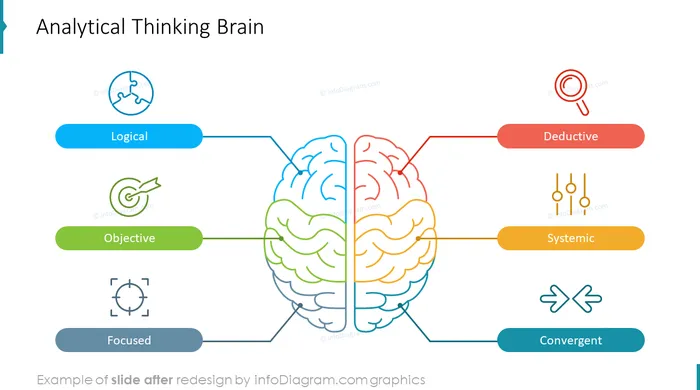
- List the qualities of analytical thinking.
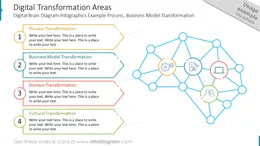
- Illustrate areas or segments of digital transformation using the shape of the brain.
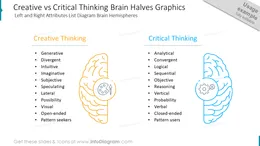
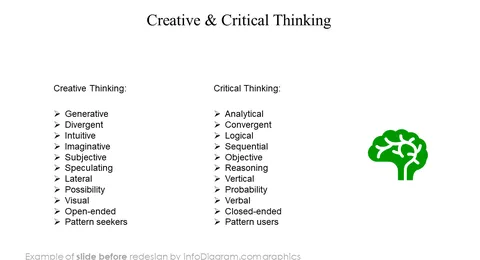
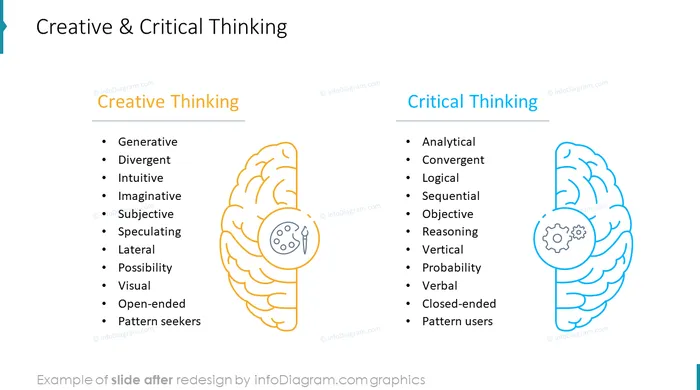
- Compare creative versus critical thinking attributes with left and right brain halves infographics.
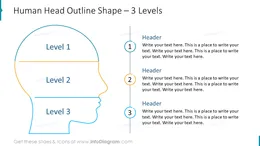
- Show layers of some structure using levels head shape diagram.
- Present segments as puzzle pieces composing a human head.
- Highlight a certain part of the brain or a lobe for simple explanations.
Try using those PowerPoint illustrations to present your content visually in an elegant way.
All graphics are editable, so you can modify the colors and text. We also added a general icon collection at the end of the presentation deck. Optionally you can also extend the collection by more PPT symbols (see Related Diagrams section).
Fully editable in PowerPoint set of vector shapes fully editable by using built-in PowerPoint tools, including
- change the color of all shapes filling and their outline, including icons
- adding shadows
- changing shape and size, rotating, flipping the object
- putting shapes behind or on top of text
See editing demonstration in our HowTo Videos.
Authors
- Design by infoDiagram's designer.
Contact: here