
Cover and narrative setup
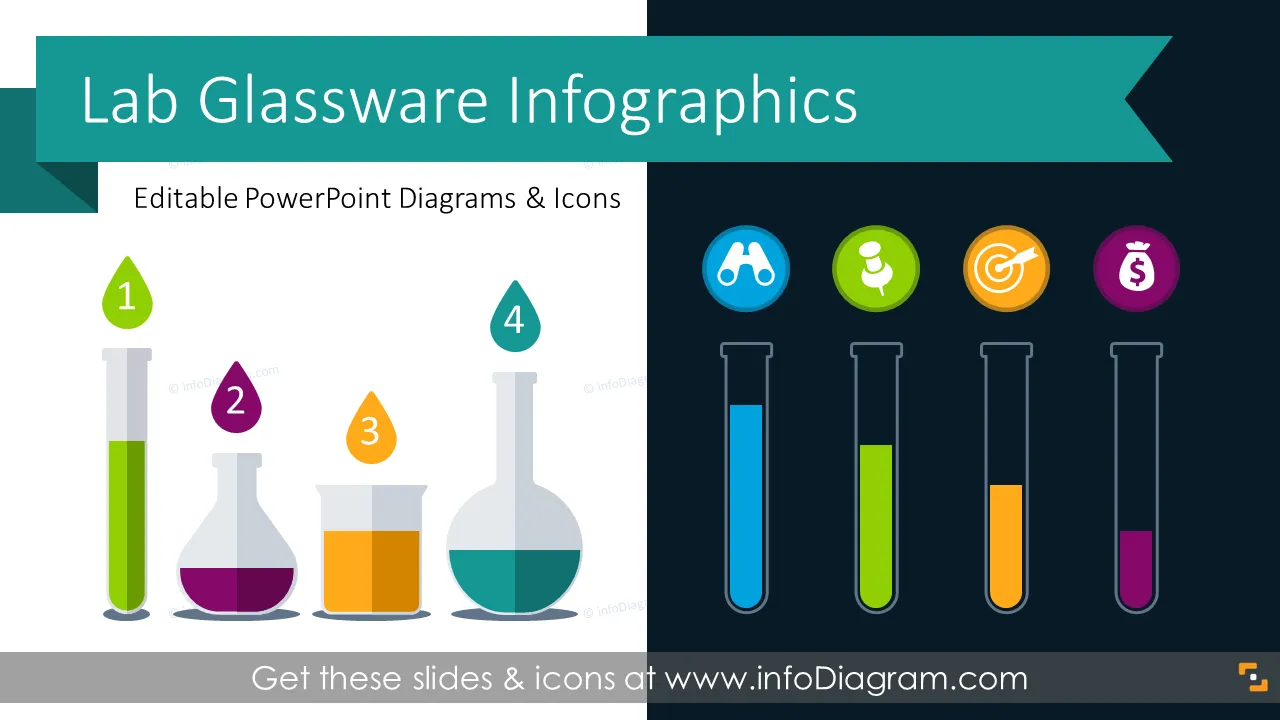

Deck preview
This template does not have a dedicated before/after case study, so we show the strongest slides from the actual deck instead.
Cover and narrative setup

Core structure and talking points

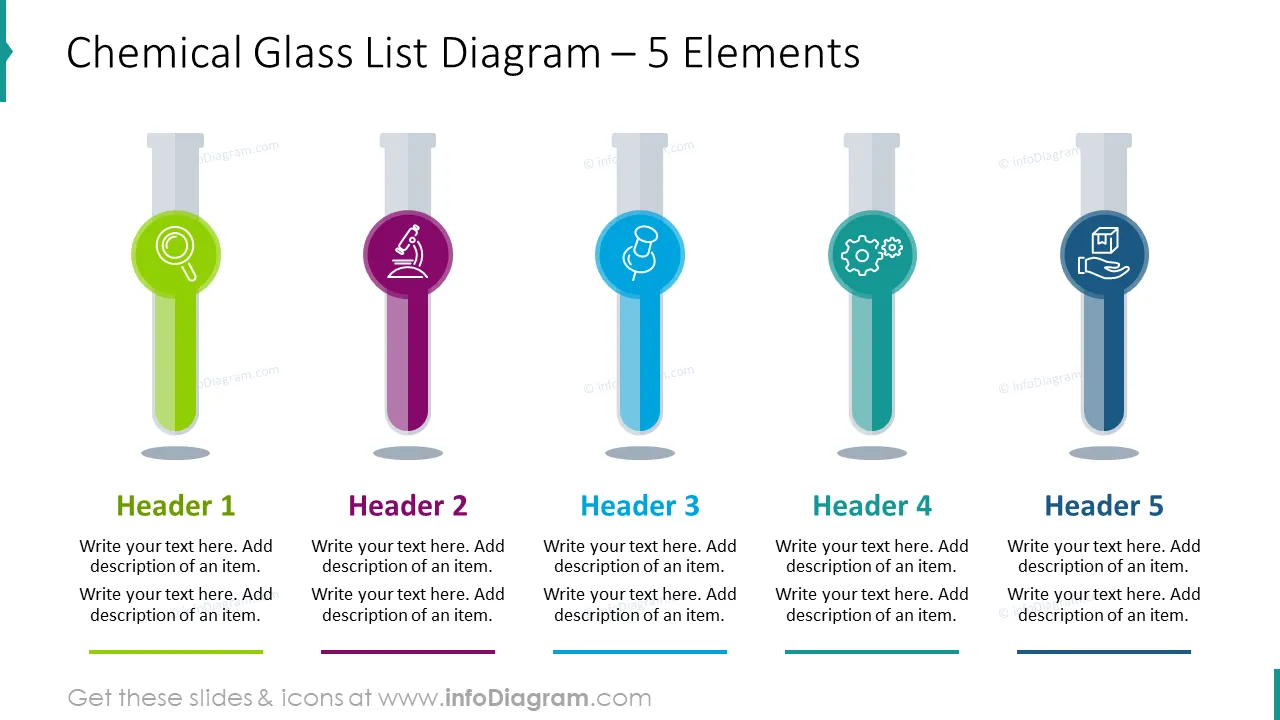
Polished visual slide from the deck
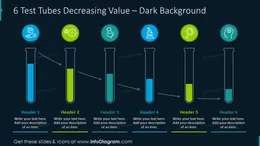
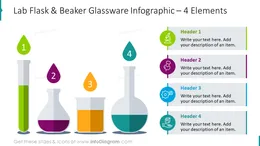
Need innovative graphics to illustrate your points? If you want to balance and support your words with pictures, check our latest chemical laboratory graphics. You can use such graphics to illustrate various concepts like filling status, progress, status indicators, experiments, research & development, precise dosing (e.g. while talking about percentage), reaction and test.
This Chemical Lab Test Tube Graphics set contains:
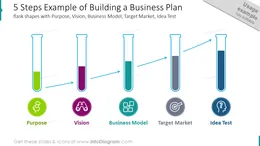
The lab equipment usually refers to the various tools used by scientists. Laboratory equipment is generally used to either perform an experiment or to take measurements and gather data. Such test tubes and other glassware can be a unique metaphor for showing various processes, progress, you can use them for creating charts or even making simple lists look different from all default presentations.
Using diagram visualizations will help you create beautiful slides to explain your thoughts better.
Try using those PowerPoint illustrations to present your content visually in an elegant way.
All graphics are editable, so you can modify the colors and text. We added also a general icon collection at the end of the presentation deck. Optionally you can also extend the collection by more PPT symbols (see Related Diagrams section).
Fully editable in PowerPoint set of vector shapes fully editable by using built-in PowerPoint tools, including
See editing demonstration in our HowTo Videos.
Vos graphiques ajoutent une belle touche à mes présentations et je les ai récemment utilisés pour l'une de mes réunions générales. Votre boîte à outils ajoute du professionnalisme à mes diapositives. Au lieu d'utiliser des cliparts standards.
Claude Jones, Directeur de l'ingénierie, @Walmartlabs, USA
J'avais besoin d'un nouveau regard sur certaines de mes diapositives. J'ai essayé de trouver un moyen de créer un effet de pinceau, de souligner, d'accentuer, d'ajouter de la couleur et les marqueurs manuscrits étaient exactement ce qu'il fallait. Très facile à utiliser, facile à ajuster la taille, à changer la couleur. C'était une solution abordable et parfaite et je suis heureux de la recommander.
Anonymous, US
L'aspect net et épuré des graphiques, et le fait qu'il m'ait permis d'éditer et de changer facilement les couleurs pour les adapter au modèle, ont été les principales raisons de mon achat.
Brandie Jenkins, Développeur E-learning, USA


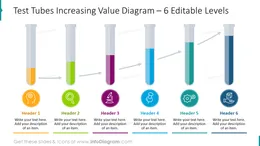
You may also need