Your graphics add a nice touch to my presentations and I recently used them for one of my all-hands meetings. Your toolbox adds professionalism to my slides. Instead of using standard clipart.
Claude Jones, Director of Engineer, @Walmartlabs, USA
Your graphics add a nice touch to my presentations and I recently used them for one of my all-hands meetings. Your toolbox adds professionalism to my slides. Instead of using standard clipart.
Claude Jones, Director of Engineer, @Walmartlabs, USA
I needed a fresh look at some of my slides. I've tried to find a way to create a paintbrush effect, to underline, accentuate, add some color and the handwritten markers were just the things. Very easy to use, easy to size, change the color. It was an affordable, perfect solution and I'm happy to recommend it.
Anonymous, US
The crisp, clean look of the graphics, and the fact that it allowed me to easily edit and change the colors to match the template was my main reason for purchasing them.
Brandie Jenkins, E-learning Developer, USA
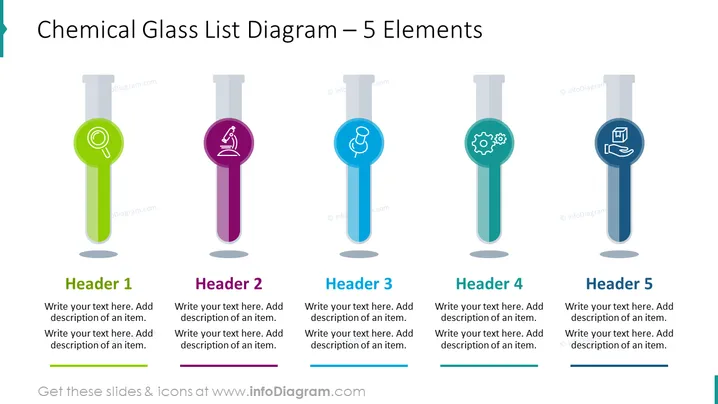
The slide titled "Chemical Glass List Diagram – 5 Elements" showcases a visual concept where five test tube graphics are used to present different ideas or components. Each test tube is distinct, corresponding with Headers 1 through 5, and contains an icon symbolizing its subject along with placeholder texts for a header and additional descriptions. This framework is designed to categorize and convey five separate, but possibly related, elements in a visually coherent manner.
The overall look of the slide is clean and modern, with the use of vector graphics providing a professional appearance. The color-coded test tubes allow for easy differentiation between the elements.


