Your graphics add a nice touch to my presentations and I recently used them for one of my all-hands meetings. Your toolbox adds professionalism to my slides. Instead of using standard clipart.
Claude Jones, Director of Engineer, @Walmartlabs, USA
Before and after
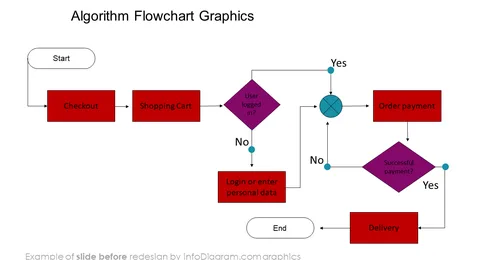
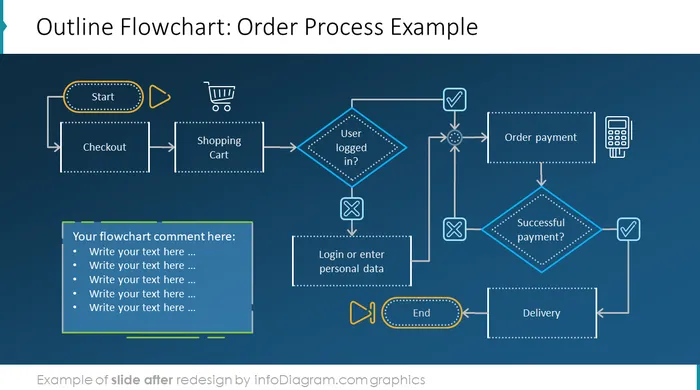
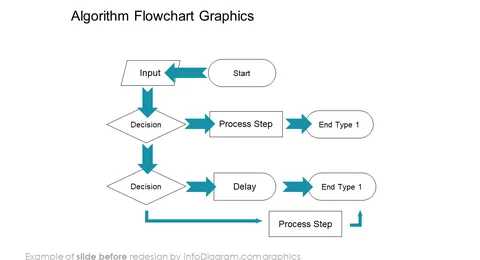
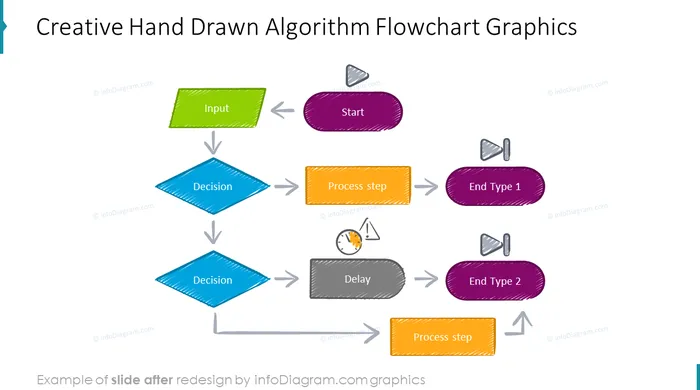
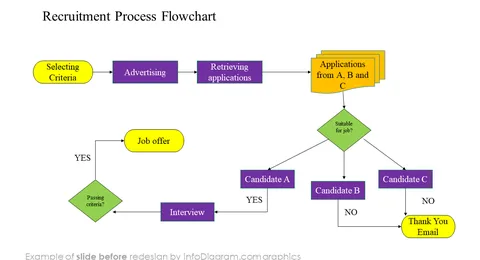

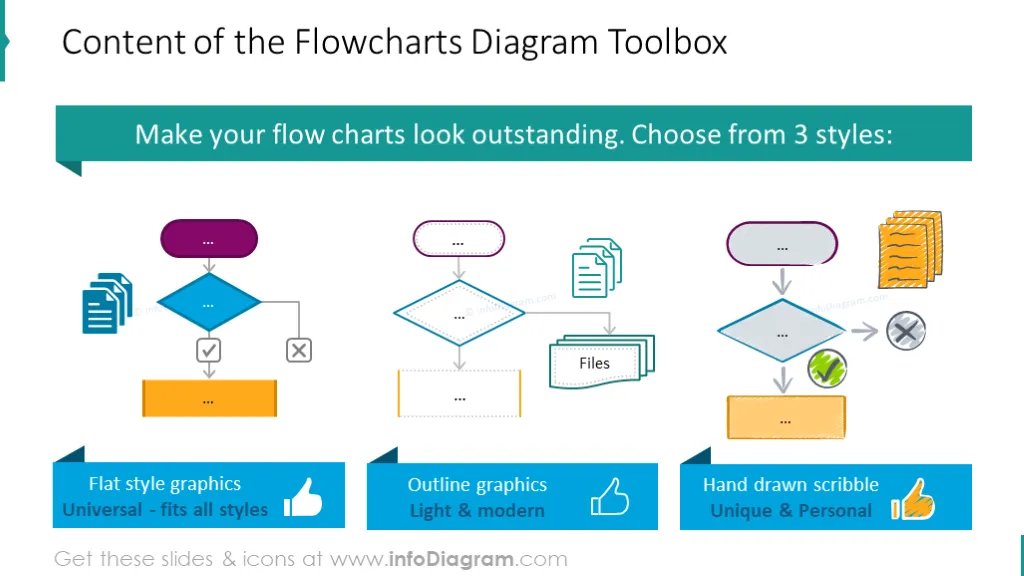
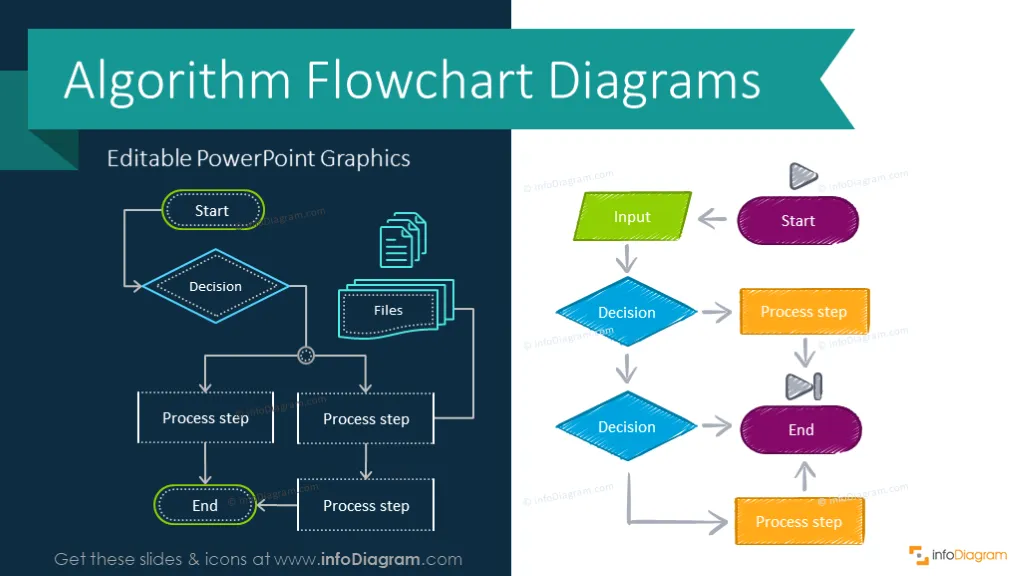
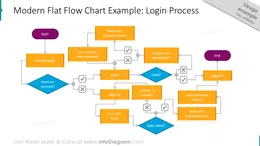
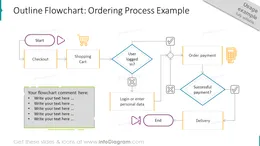
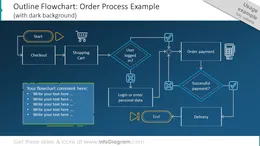
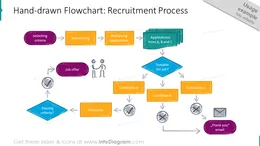
Flow chart template with creative infographics design made in PowerPoint. You can apply these editable flowcharts to illustrate how informatics algorithm works or various decision processes.
This flowchart PPT slide template contains:
Format: fully editable vector shapes (modify colors of diagrams and icons, resize without quality loss)
Visual representation of workflow in the form of specific diagram shapes connected by arrows. Typically used to present a decision process or in IT to represent algorithm steps. The flow charts have defined start and end status nodes, input/output nodes, and decision points (usually a binary answer question or condition that results in positive and negative output path).
Using process flow visuals helps to:
Process Flow Chart Diagram contains ready-to-use slides:
The full list of the symbols presented in the Process Flow Chart Diagram:
Fully editable in PowerPoint set of vector shapes fully editable by using built-in PowerPoint tools, including
See editing demonstration in our HowTo Videos.
Your graphics add a nice touch to my presentations and I recently used them for one of my all-hands meetings. Your toolbox adds professionalism to my slides. Instead of using standard clipart.
Claude Jones, Director of Engineer, @Walmartlabs, USA
I needed a fresh look at some of my slides. I've tried to find a way to create a paintbrush effect, to underline, accentuate, add some color and the handwritten markers were just the things. Very easy to use, easy to size, change the color. It was an affordable, perfect solution and I'm happy to recommend it.
Anonymous, US
The crisp, clean look of the graphics, and the fact that it allowed me to easily edit and change the colors to match the template was my main reason for purchasing them.
Brandie Jenkins, E-learning Developer, USA


You may also need