Do you need to present specific aspects of your inventory and stock management performance, highlighting current stock levels, turnover rates, order fulfillment efficiency, or any recent improvements in inventory control processes?
Use our ready-content ppt to convey your message in an attractive and eye-catching format.
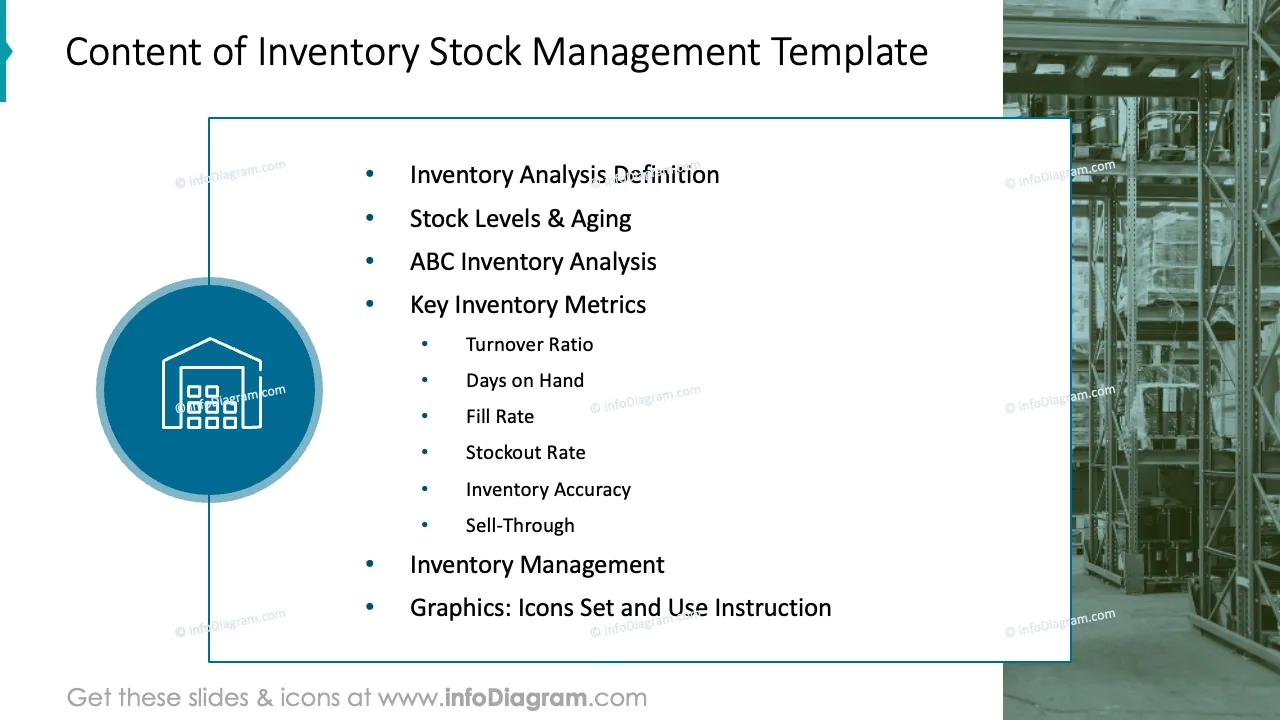
This Inventory Metrics Analysis and Stock Management Presentation Template contains slides with the following:
- 19 charts, tables, and diagrams illustrating various issues related to stock inventory
- 78 icons illustrating inventory financial issues: Stock Management, Inventory Movements, Key Inventory Metrics, and Inventory Strategy
- Instruction on modifying those diagrams using standard PowerPoint editing tools.
This PowerPoint slide deck is designed in an elegant flat style with colorful vector illustrations and outline icons. All graphic shapes can be recolored and resized without quality loss.
Authors of this Inventory Metrics Analysis and Stock Management Presentation Template
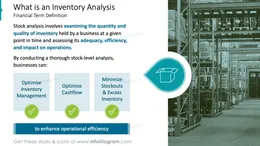
What is inventory analysis?
Stock-level analysis involves examining the quantity of inventory a business holds at a given time and assessing its adequacy, efficiency, and impact on operations. By conducting a thorough stock-level analysis, businesses can optimize inventory management practices, improve cash flow, minimize stockouts and excess inventory, and enhance overall operational efficiency.
Why analyze stocks within the organization?
Financial Managers pay close attention to where the company’s resources are tied. The company’s money can be locked up in excess inventory. Faster stock turnover means the company can quickly convert its products into cash, improving liquidity. Organizations can optimize operations, reduce costs, and improve overall business performance by regularly analyzing inventory.
Present your stock situation using infographics appropriate for your business. To upgrade your presentation slides, you can use our content-ready PowerPoint template. Our slides are easy to edit, altering the content, values, colors, and look and feel.
Where can you use the inventory analysis PPT template?
Using infographics in your capital inventory performance follow-up will help you organize information in a visually appealing format and present your numbers in a compelling way that is easy for your audience to understand.
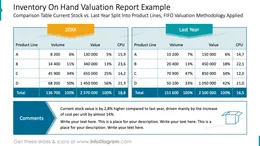
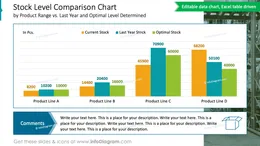
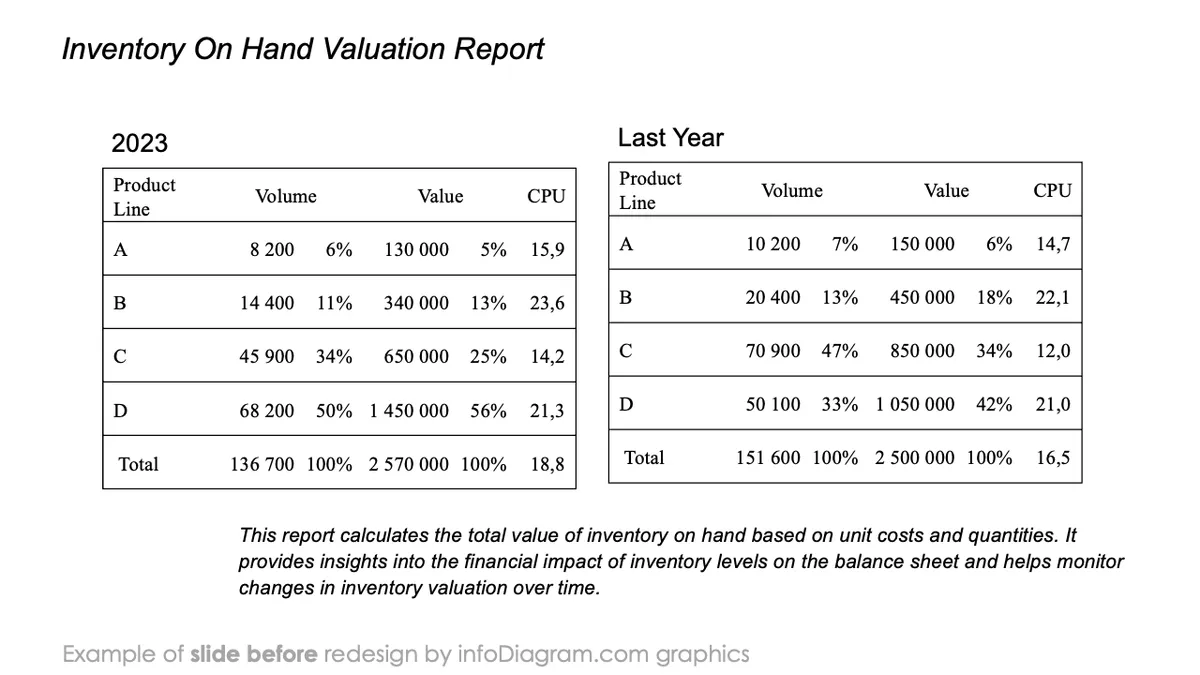
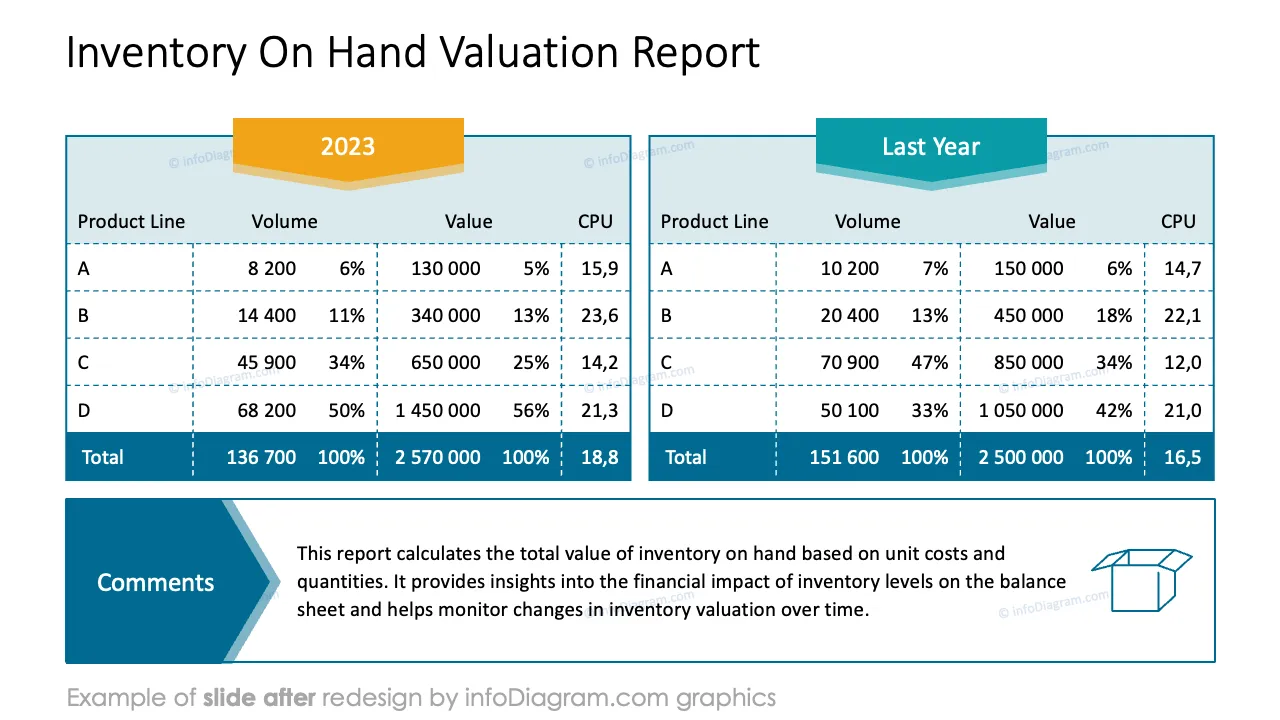
- Compare your current stock versus last year and the optimal level the forecasting team determines using a pre-designed table or chart.
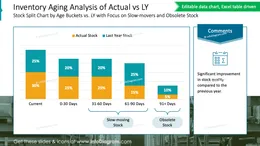
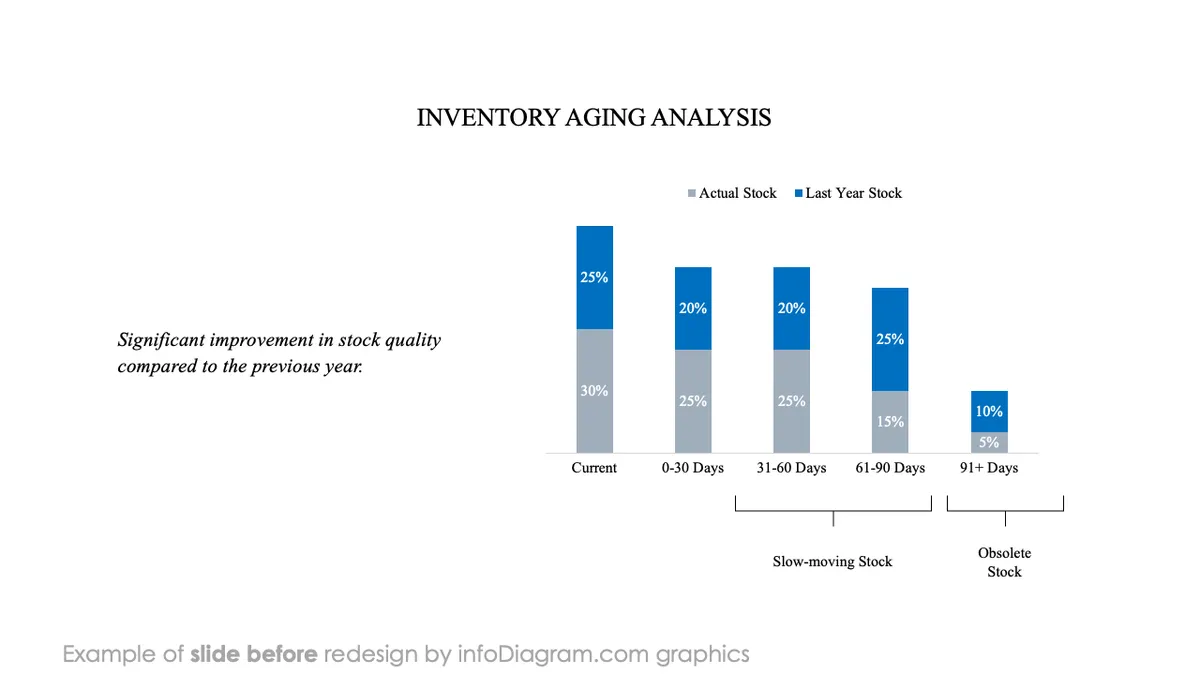
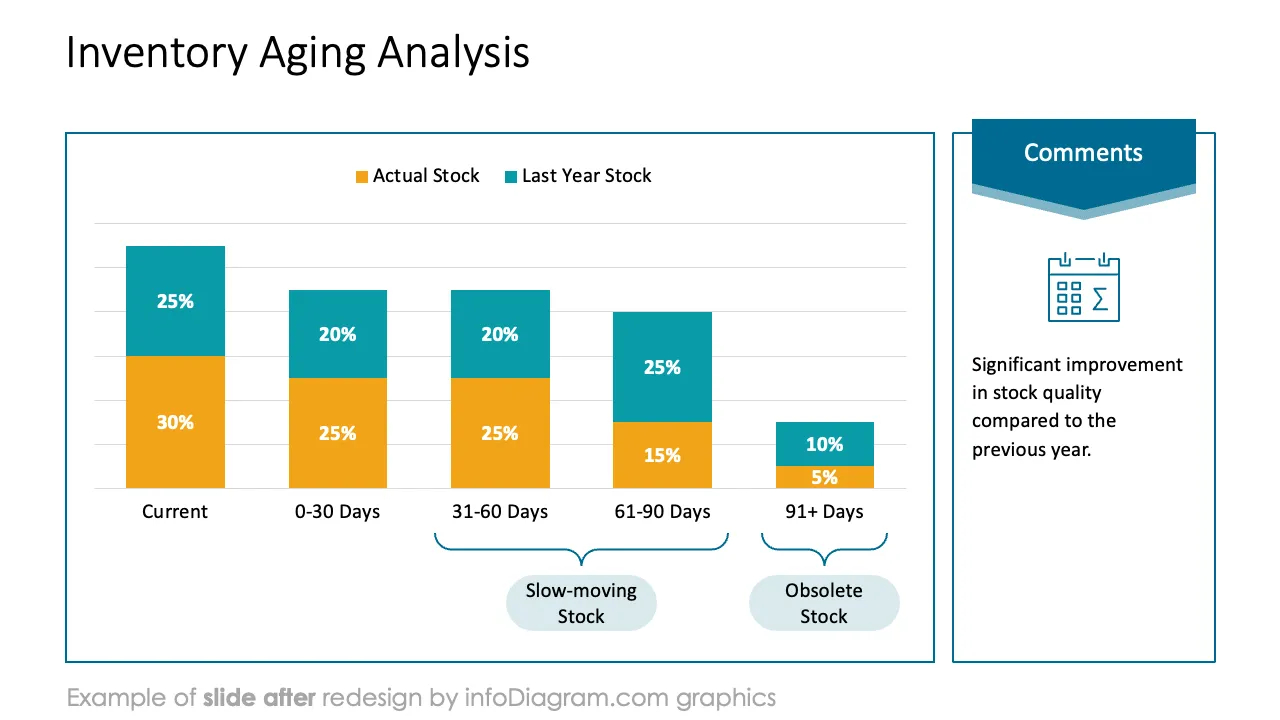
- Conduct stock aging analysis, splitting your inventory into age brackets and highlighting slow-moving and obsolete stock.
- Categorize your inventory items based on their importance to the business using the ABC y-axis graph.
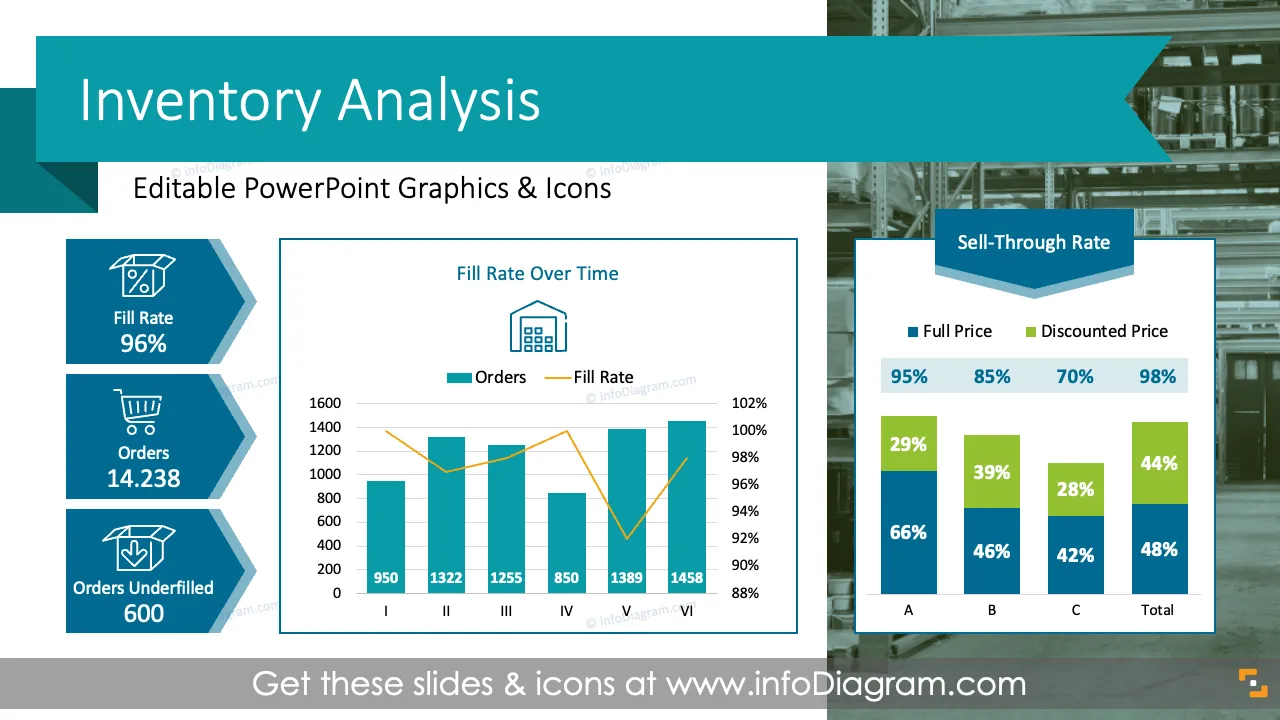
- Illustrate inventory metrics, among others: turnover ratio, days on hand, fill rate, stockout rate, inventory accuracy, and sell-through using tables, pie, bar, and radar charts, adding your relevant observations in pre-designed comment boxes.
- Present your stock reduction initiatives, specifying goals, objectives, action plans, expected outcomes, and responsible persons.
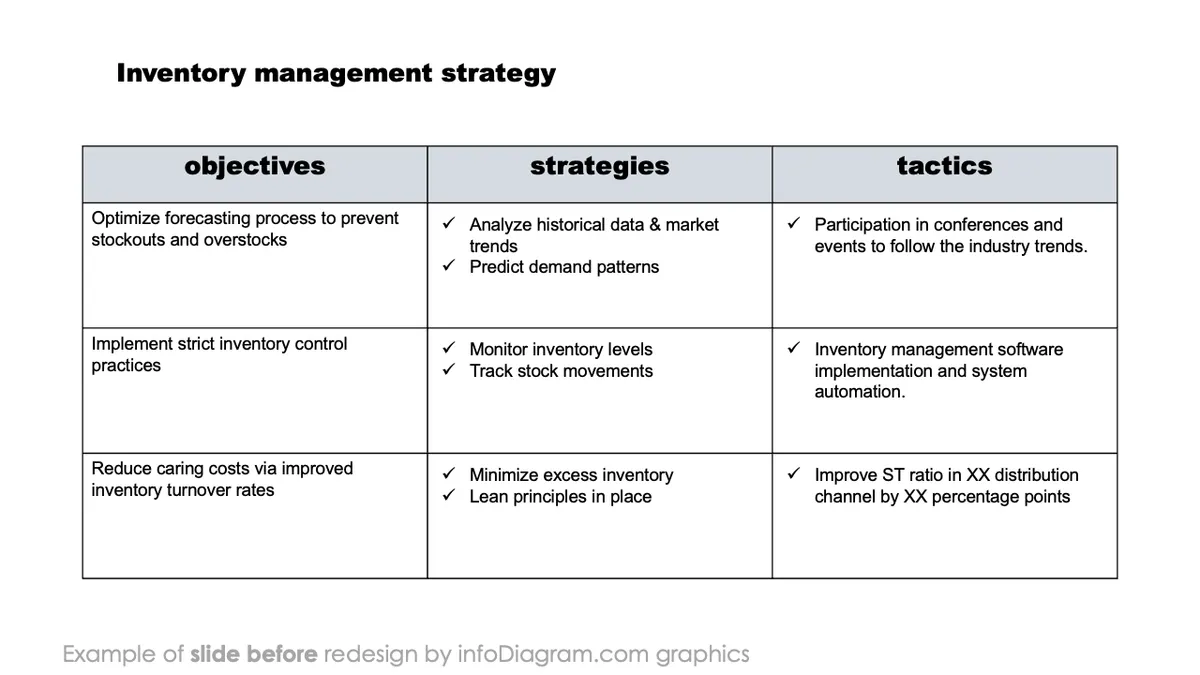
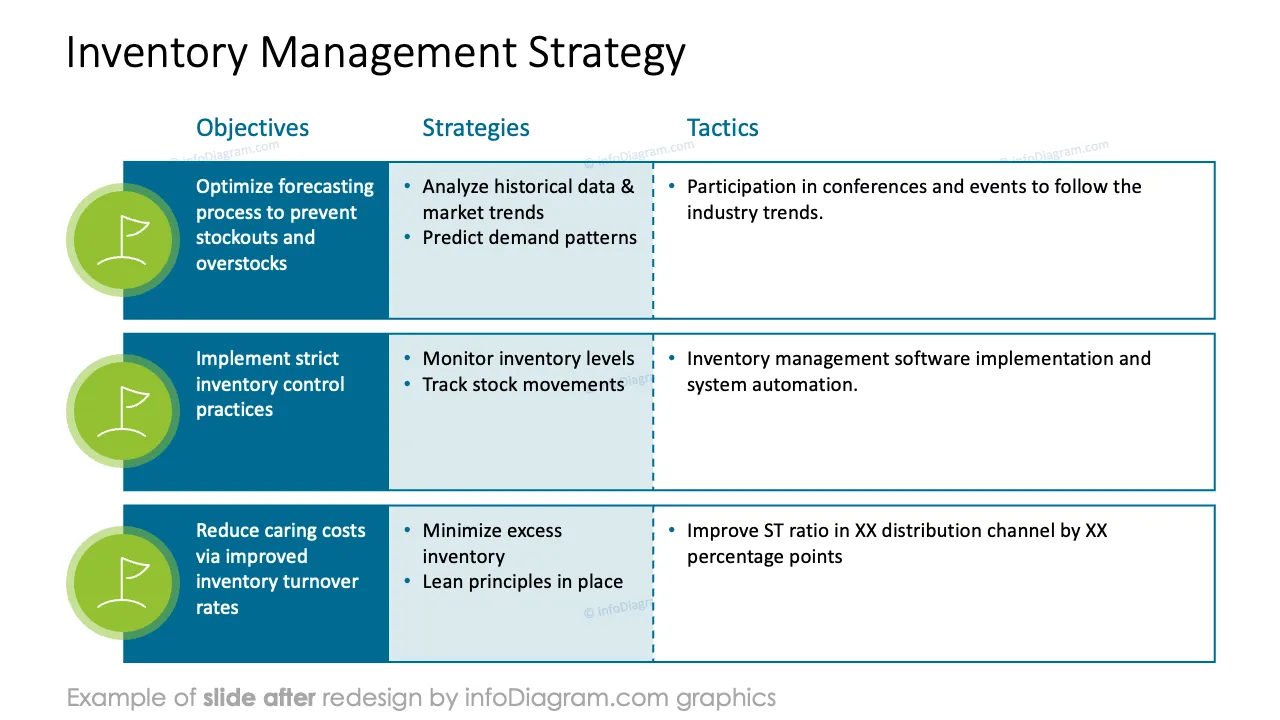
- Address your inventory management focus with objectives, strategies, and tactics for operational efficiency.
- Use our icons set, which we have prepared especially for this deck, to visualize issues related to inventory analysis.
Try using those PowerPoint graphics to present your data visually in an elegant way.
All graphics are editable to modify the size, colors, and text. Also, you can extend the collection further with more PPT symbols (see Related Diagrams section).
Try using thisset of fully editable PowerPoint vector shapes to present your data visually in an elegant way. You can easily modify all elements:
- Replace icons
- Change the filling and outline color
- Modify size and proportions
- Rotate, flip, align, and change order
Slides included in this PowerPoint Presentation: