Do you need to review a goal completion, present your business KPI achievement level?
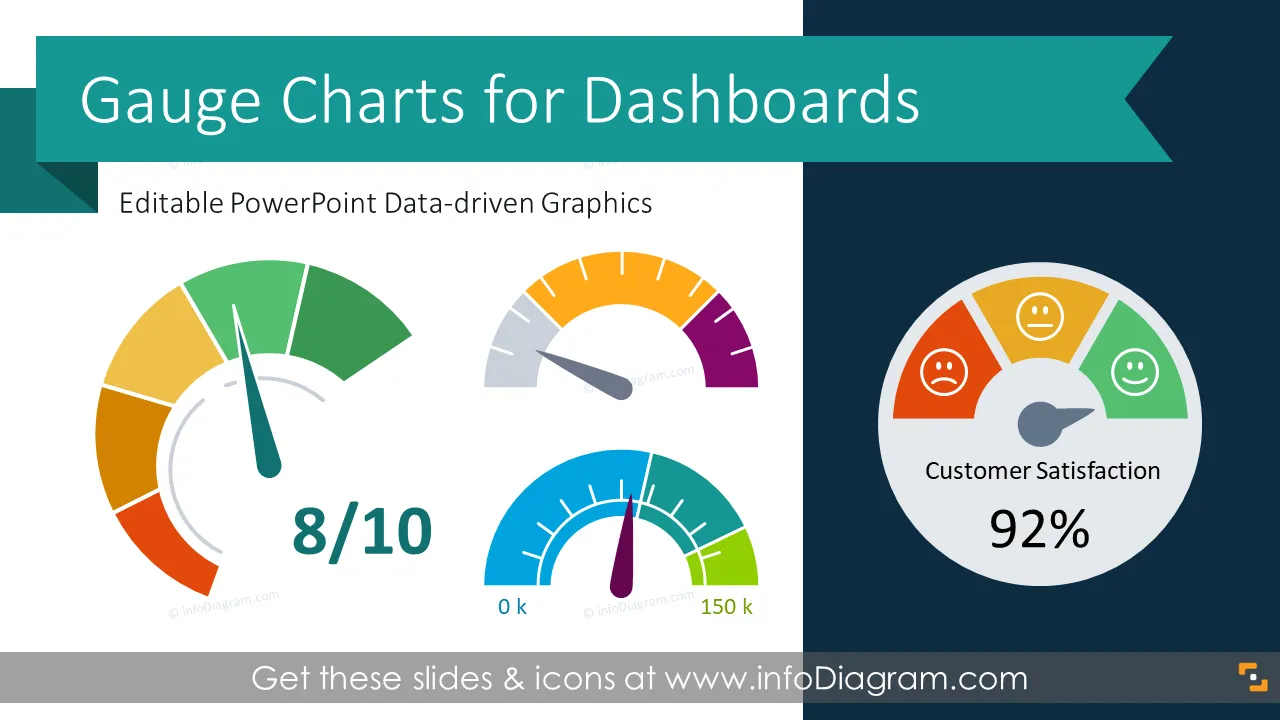
Illustrate your performance index on a slide with a colorful speedometer graph visuals. Show whether your objectives are below, close or over the target value.
We have designed an easy to use gauges graphics with editable data-driven Excel charts.
This Gauges PowerPoint template includes editable charts including:
- 20 slide layouts with various progress indicator gauges to present KPI levels. Add your business indexes, change KPI data value.
- 43 icons in two modern styles - universal flat and light elegant line graphics. Use them to illustrate your business performance indices such as production volumes, financial indicators, client services satisfaction and activity status states e.g. a positive one - completed tasks, warning status, negative not reached status.
- Format: fully editable vector shapes (modify colors of charts or icons, resize without quality loss
What is a gauge chart?
It is a circular shape graph, resembling a speedometer. The gauge charts are similar to doughnut charts with a needle that points to data range according to measured values. Data range usually shows gradual change from a low to a high level of the variable with assigned status colors (e.g. red, yellow, green or blue - red temperature colors). Gauges can have an additional indicator of a target of a threshold value.
Why to use Gauges charts in a presentation?
Those charts are good visual tools to represent an achievement level or progress indicators of various business objectives. Move the central needle to show a low, middle or high levels of your measured data.
- Gauges are intuitive and easy to understand - one look tells you if you are in good or bad numbers. People are familiar with speedometer design, so you don’t need to explain how to read them.
- They are attractive to look at. Presentation with such visuals will get attention much better than having only numerical values.
- They help to give a big-picture even when showing several gauge indicators on one slide.
- Gauge charts are easy to modify - most of them are data-driven, where you edit the underlying Excel chart and data ranges with change accordingly.
- You can quickly customize the Gauge charts, adding an icon representing a specific KPI area or writing a commentary next to the chart.
Where to use gauge charts?
Here are a few examples where you can apply these speedometer graphics:
- Design an eye-catching business dashboard showing level of your KPIs.
- Represent an overview of financial company performance indicators e.g. revenue, sales, profit margins.
- Review a key production quality measurement board evaluating current manufacturing, distribution and supplies volumes.
- Create a project development status template, where each task has its own small gauge indicator.
- As a fancy risk meter visual showing how far are you from critical values.
When it comes to present data in an understandable way, charts can help your slides stand out. Gauge chart is a very common chart used in information dashboards and you can use a speedometer chart when you want to show a single value within a given scale. Gauge charts are great for visualizing KPI values and performance indicators
Gauge charts for KPI dashboards contains ready-to-use slides:
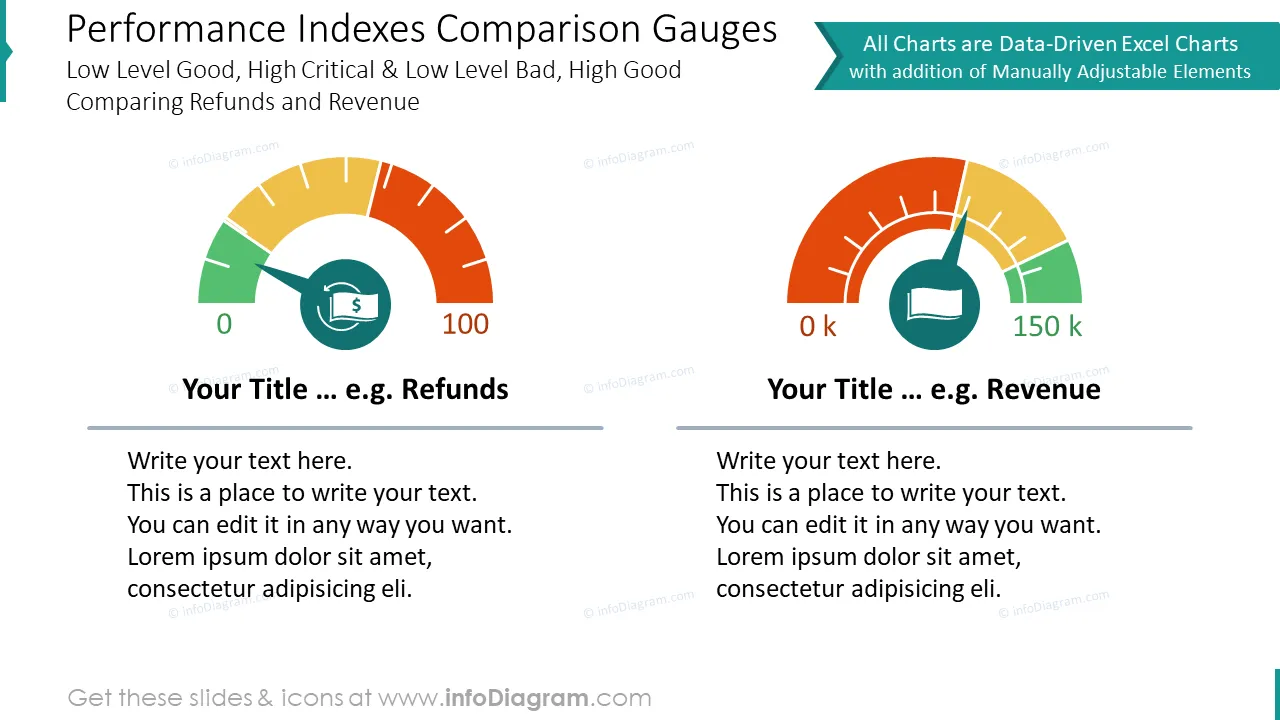
- Performance indexes comparison gauges charts
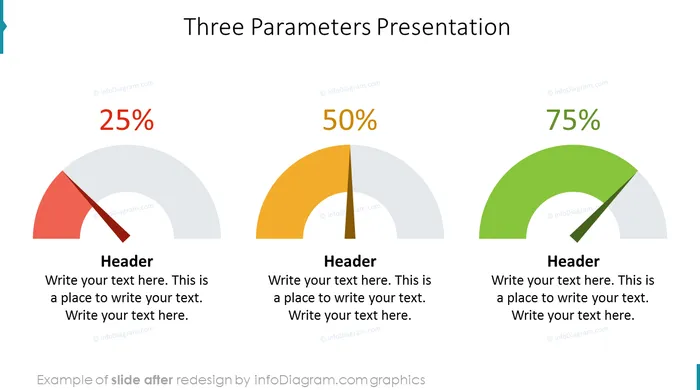
- Three performance index comparison infographics
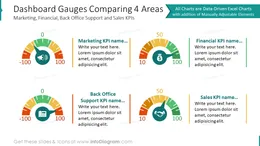
- Dashboard gauges diagram comparing four areas: marketing, financial, back office support and sales KPIs
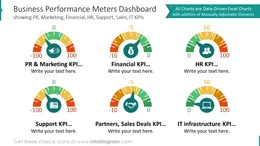
- Business performance meters dashboard showed with flat icons
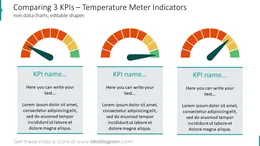
- Comparing two-, three KPIs showed with temperature meter indicators
- Project goal completion speedometer infographics
- Performance dashboard template illustrated with double speedometer charts
- Performance KPI scorecard gauge indicator data-driven chart
- Animated gauges charts for two product categories with comment fields
- Current and forecasted company expenses depicted with speedometer data-driven graph
- Actual and maximum budget spent speedometer graphics
- Gender ratio distribution infographics: male to female ratio split pie chart
- Production level to sales ratio gauge charts with actual and target values split
- Outline gauges graphics for three KPI’s: operational, call center and back office indicators icons example
- Production company performance dashboard with outline gauges charts
- Customer satisfaction meter template with three adjustable levels
- Triple gauges comparison dashboard design showed with three double values pie chart
- Comparing two KPIs performance template: client satisfaction and retail sales
- Product defects and quality assurance depicted with KPIs gauges charts
On the last part of this deck, we added a set of icons you can use too, to additionally illustrate the specific KPI measure. You can extend this set by getting more business symbols (see Related Diagrams section).
Colors of all symbols, charts, and text are easy to modify (all graphics are in a vector format). So you can change them to colors of your template or company brand.
Fully editable in PowerPoint set of vector shapes fully editable by using built-in PowerPoint tools, including
- changing the color of the icon filling and its outline
- adding shadows
- changing shape and size, rotating, flipping the object
- putting shapes behind or on top of text
See editing demonstration in our HowTo Videos.
Authors
- infoDiagram's designer
- Contact: here