Your graphics add a nice touch to my presentations and I recently used them for one of my all-hands meetings. Your toolbox adds professionalism to my slides. Instead of using standard clipart.
Claude Jones, Director of Engineer, @Walmartlabs, USA
Your graphics add a nice touch to my presentations and I recently used them for one of my all-hands meetings. Your toolbox adds professionalism to my slides. Instead of using standard clipart.
Claude Jones, Director of Engineer, @Walmartlabs, USA
I needed a fresh look at some of my slides. I've tried to find a way to create a paintbrush effect, to underline, accentuate, add some color and the handwritten markers were just the things. Very easy to use, easy to size, change the color. It was an affordable, perfect solution and I'm happy to recommend it.
Anonymous, US
The crisp, clean look of the graphics, and the fact that it allowed me to easily edit and change the colors to match the template was my main reason for purchasing them.
Brandie Jenkins, E-learning Developer, USA
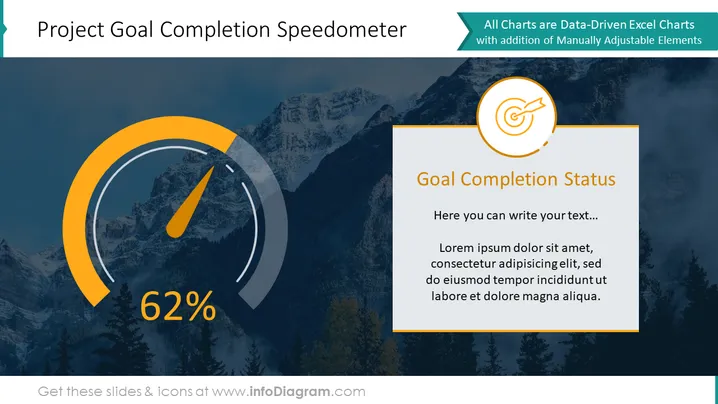
The slide presents a progress indicator resembling a speedometer, showing that a project goal is 62% complete. This visual metaphor for tracking the progress of goals or objectives is titled "Goal Completion Status." Next to the speedometer graphic, a content area titled "Goal Completion Status" provides a placeholder for explanatory text or further details on the project's progress. The speedometer element serves as an engaging and immediate way to communicate the level of completion, which is a critical piece of information for project stakeholders to assess progress at a glance.
The slide has a professional and dynamic aesthetic, leveraging contrasting colors and a clean design to emphasize the project's progress. The integration of text and graphical elements creates a balanced layout that conveys information effectively.


