Your graphics add a nice touch to my presentations and I recently used them for one of my all-hands meetings. Your toolbox adds professionalism to my slides. Instead of using standard clipart.
Claude Jones, Director of Engineer, @Walmartlabs, USA
Your graphics add a nice touch to my presentations and I recently used them for one of my all-hands meetings. Your toolbox adds professionalism to my slides. Instead of using standard clipart.
Claude Jones, Director of Engineer, @Walmartlabs, USA
I needed a fresh look at some of my slides. I've tried to find a way to create a paintbrush effect, to underline, accentuate, add some color and the handwritten markers were just the things. Very easy to use, easy to size, change the color. It was an affordable, perfect solution and I'm happy to recommend it.
Anonymous, US
The crisp, clean look of the graphics, and the fact that it allowed me to easily edit and change the colors to match the template was my main reason for purchasing them.
Brandie Jenkins, E-learning Developer, USA
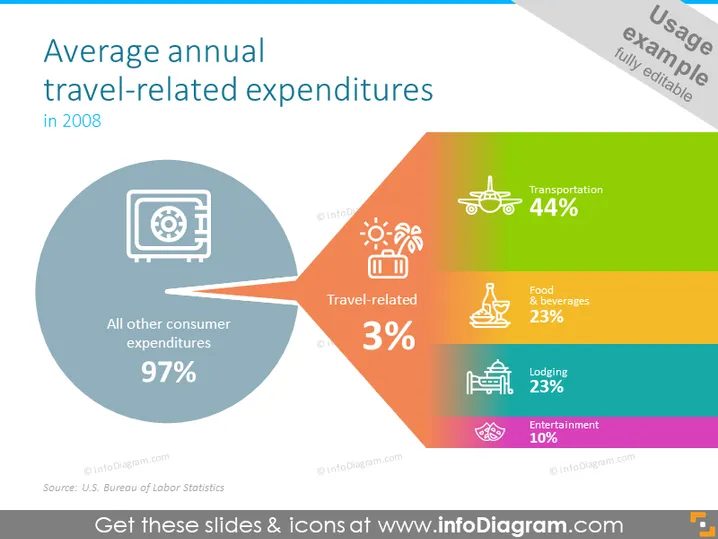
The slide presents data on the average annual travel-related expenditures in 2008, showcasing that 3% of overall consumer spending was dedicated to travel. The remaining 97% is represented as 'All other consumer expenditures'. The travel expenses are further broken down into categories: Transportation accounts for 44%, indicating it's the most significant expense, followed by Food & beverages and Lodging, each taking up 23%, and Entertainment expenses at 10%, which suggests it is the least considerable individual cost within the travel sector.
The slide features a modern and intuitive design that clearly differentiates between the major segment of consumer expenditures and the specified segment of travel-related costs. The use of bright, distinct colors and easily recognizable icons makes the data approachable and easy to understand at a glance.


