PowerPoint template for Six Sigma training and presentation materials. We designed editable infographics explaining Six Sigma principles, underlying statistical theory and main 6S processes such as DMAIC cycle, DMADV cycle within DFSS, Concept Questions or Lean Problem Solving Workflow. These diagrams can be used to visualize the Six Sigma approach to production or general business processes improvements.
The Six Sigma presentation template deck includes:
- 16 modern diagrams of 6 Sigma concepts and principles. We added also a template to list Six Sigma Steps, Pros and Cons comparison and list of industrial application of 6S. All flowcharts are in a universal flat graphical style that fits various branding styles.
- 36 editable icons that you can use to illustrate Six Sigma concepts e.g. 6S stages: Define, Measure, Analyze, Improve, Control, Search, business symbols of productivity, design, goal.
- Format: fully editable vector shapes (modify colors of diagrams and icons, resize without quality loss
What is the concept of Six Sigma?
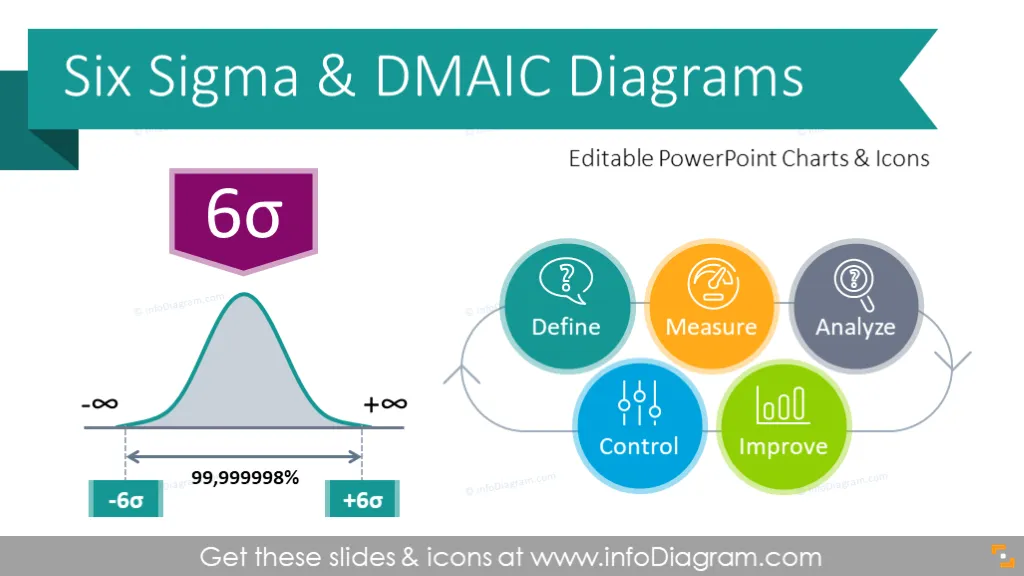
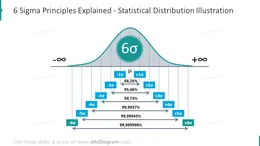
Six Sigma framework was developed by Motorola (Bill Smith and Bob Galvin) in the '80s. The purpose of this Six Sigma approach it to create a system for quality improvement process. The main principle of Six Sigma is to systematically work on decreasing number of defects in the production process, to a level that is statistically insignificant - hence the 6 sigma name. It represents very low probability of event occurrence - under 0,000002% = 100% - 99,999998% the probability of event occurrence. For comparison, one sigma corresponds to defect probability 31,7% - that is almost every 3rd product to have a defect.
What are the stages of Six Sigma project management technique?
Typical Six Sigma Steps diagram illustrates five stages in this project management framework, often known as DMAIC or DFSS (for design related processes).
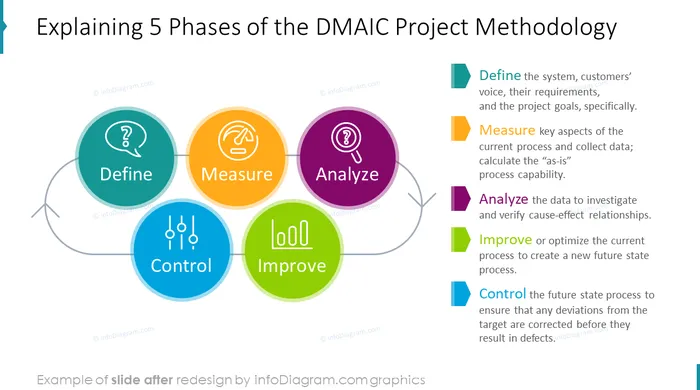
DMAIC is the main project approach within Six Sigma methodology representing improvement process cycle. DMAIC is an acronym that stands for Define, Measure, Analyze, Improve and Control. DMAIC cycle is applied to optimize the production of a general business process.
Six Sigma for the case of Design processes (not production improvement) is called DFSS - this acronym stands for Design for Six Sigma. DMADV cycle in Six Sigma is an alteration of DMAIC process, adapted for Design in Six Sigma. DFSS process diagram is composed of Define, Measure, Analyze, Design (instead of Improve) and Verify (instead of Control).
Six Sigma presentations diagrams slide deck covers those topics
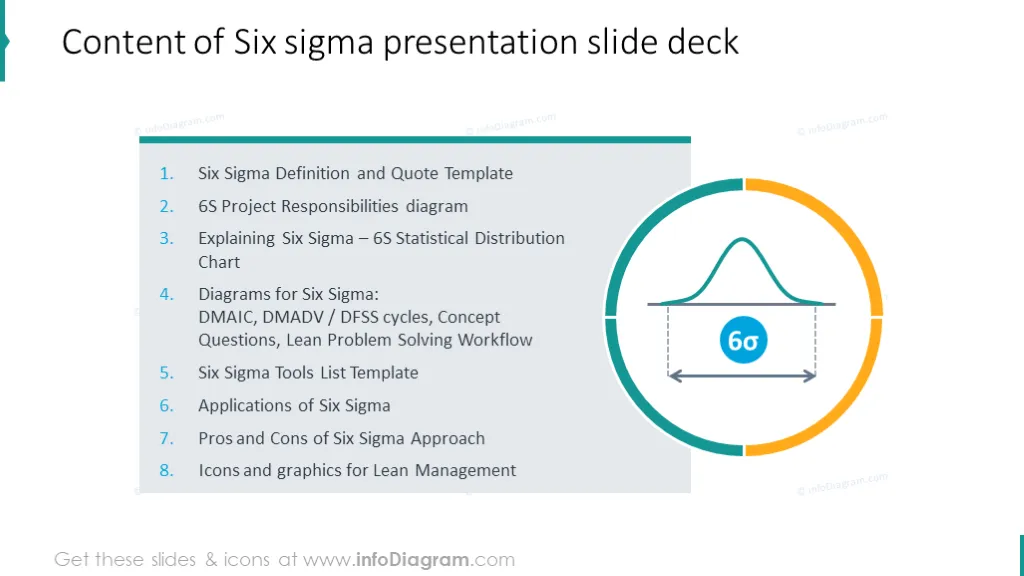
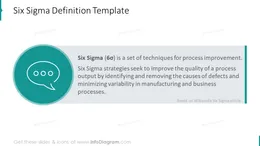
- Six Sigma Definition and quote template related to Six Sigma technique (editable text)
- 6S Project Responsibilities diagram
- Explaining Six Sigma – 6S Statistical Distribution Chart
- Diagrams for Six Sigma: DMAIC, DMADV / DFSS cycles, Concept Questions, Lean Problem Solving Workflow
- Six Sigma Tools List Template
- Applications of Six Sigma
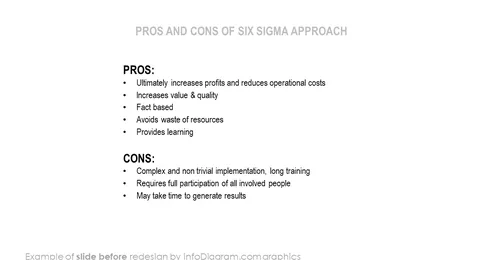
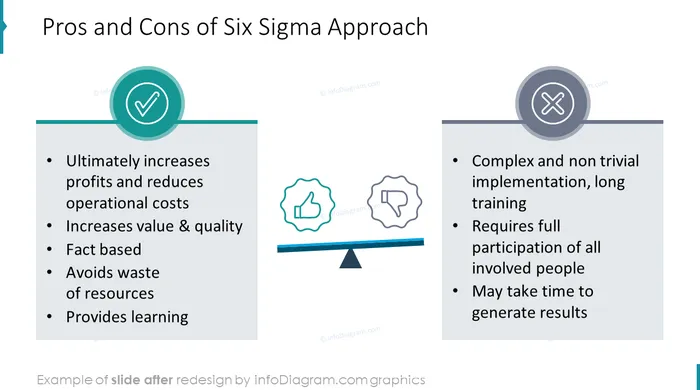
- Pros and Cons of Six Sigma Approach
- Icons and graphics for Lean Management
How to use 6S template diagrams as your presentation visuals?
Simply copy one of the diagrams into your presentation, to illustrate it by vivid visuals. You can modify each shape color, add text descriptions or replace symbols.
Why to use diagrams as your presentation illustrations?
Using diagrams helps to explain principles of Six Sigma in a modern, clear and eye-catching way.
On last slides, you have a set of icons you can use to extend your slides. You can also expand this symbols collection by getting additional PPT icons (see Related Diagrams section).
Colors of these diagram shapes and icons are fully editable (all graphics is a vector format). So you can change them to colors of your template or company brand.
Content description
Six Sigma Presentation contains ready-to-use slides:
- Six Sigma presentation slide deck content and definition slides illustrated with colorful icons and text placeholder with filling.
- Six sigma quotation slide with speech marks graphics and text description.
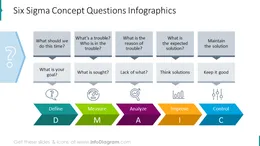
- Six Sigma concept questions illustrated with colorful shapes and icons.
- Six Sigma principles explained using colorful statistical distribution scheme.
- Distribution diagram illustrated with a text description and scheme with filling.
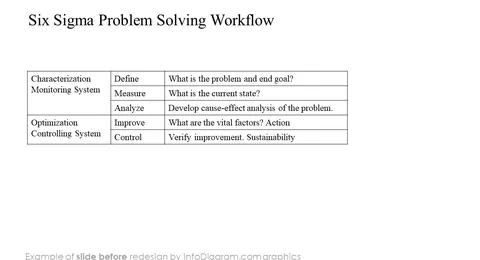
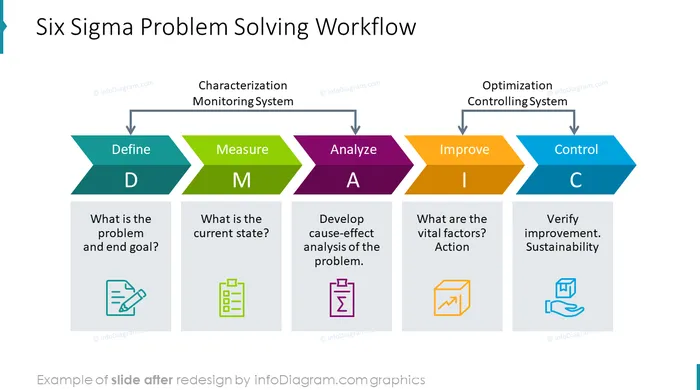
- Problem-solving workflow shown with a scheme and outline icons for explaining the following stages: define, measure, analyze, improve, control.
- Project DMAIC cycle diagram with description for each step: define, measure, analyze, improve, control.
- Project responsibilities slide: DMAIC process list multicolor diagram with icons.
- DMAIC colorful scheme for presenting Six Sigma methodology.
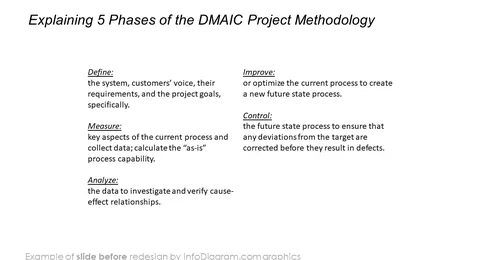
- Five phases of the DMAIC methodology shown with a modern diagram and description of each item: define, measure, analyze, improve, control.
- Colorful cycle diagram illustrated with flat icons and text placeholder for presenting five DMADV phases: define, measure, analyze, design, verify.
- DMAIC and DFSS/DMADV colorful circle diagram with a place for a brief description.
- Six Sigma tools list illustrated with outline icons and bullet points description.
- Industry areas of Six Sigma applications shown with list diagram with filling and outline icons.
- Pros and cons of six sigma approach comparison table and balance graphics.
- Outline and flat icons collection for illustrating Six Sigma concepts:
- Tools, Question, Define, Measure, Analyze, Improve, Control, Search;
- Productivity, Definition, Quote, Document, Define, Measure, Analyze, Improve, Control, Design, Pros, Cons;
- Define, Measure, Verify, goal, Design, Pros, Cons;
- Manufacturing, Engineering and Construction, Finance, Supply Chain, Healthcare, Computer, IT;
- Define, Measure, Analyze, Improve, Control.
Fully editable in PowerPoint set of vector shapes fully editable by using built-in PowerPoint tools, including
- changing color of the icon filling and its outline
- changing shape and size, rotating, flipping the object
- relocating and resizing diagrams, putting shapes behind or on top of text
See editing demonstration in our HowTo Videos.
Further resources on lean management
Authors
- infoDiagram's designer
- Contact: here