

Cover and narrative setup
Deck preview
This template does not have a dedicated before/after case study, so we show the strongest slides from the actual deck instead.
Cover and narrative setup
Core structure and talking points
Polished visual slide from the deck
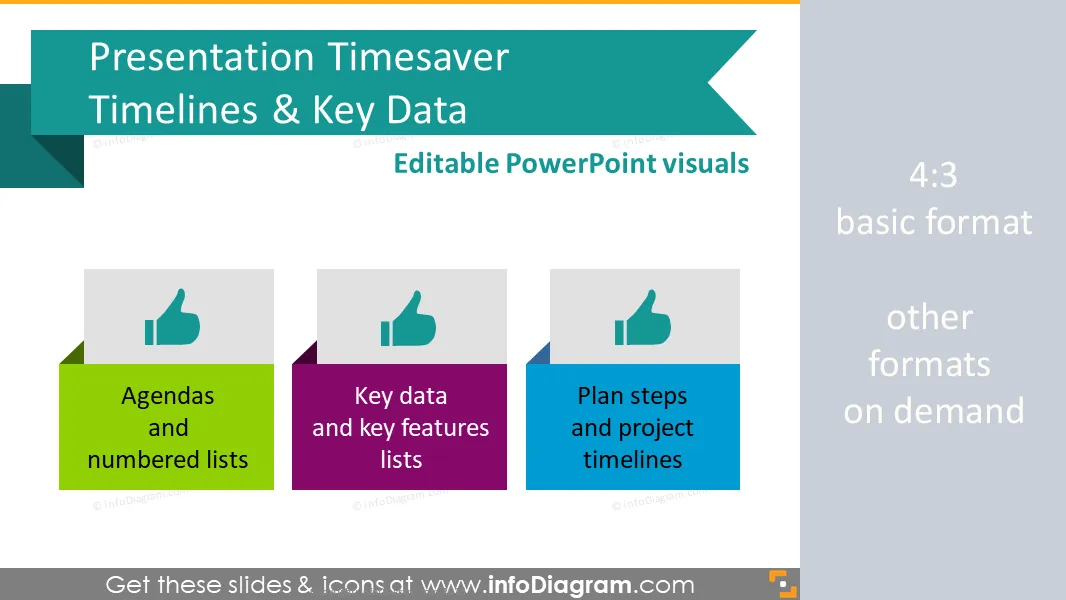
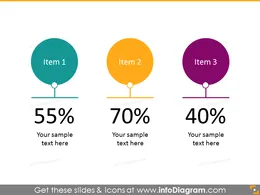
Time-saver graphics for business presentations. Make quickly an agenda. Show key numbers on a slide or features list. Display project plan, present Gantt chart and tasks status.
Presentation timesaver graphics: Timelines, Agenda, Key Indicators diagrams and placeholders for PowerPoint slides.
Contains:
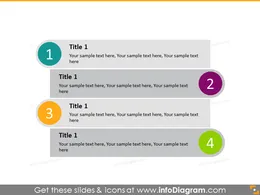
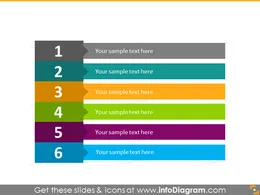
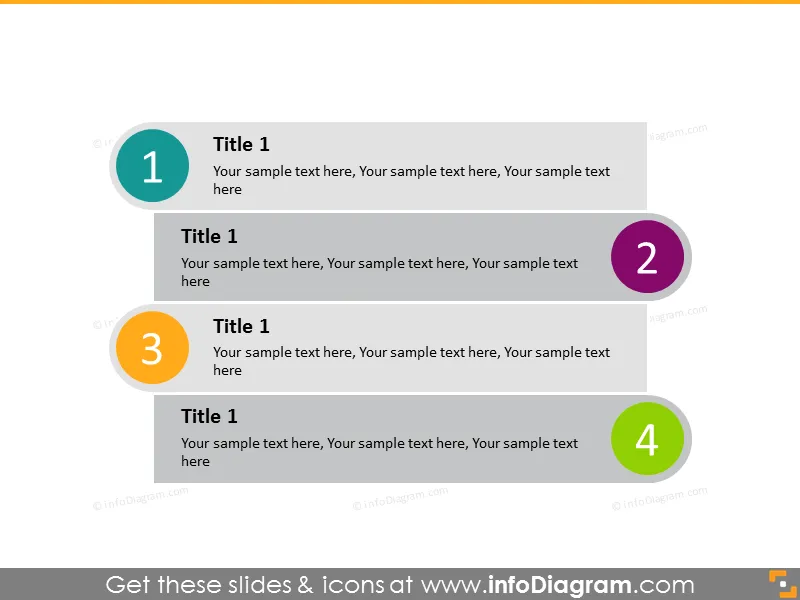
* Infographics for showing Lists [ (Slideshare presentation) ](http://www.slideshare.net/infoDiagram/infographics-text-lists-powerpoint-diagrams)
* Infographics for showing timelines [ (Slideshare presentation) ](http://www.slideshare.net/infoDiagram/infographics-shapes-timelines-ppt-infodiagrampart2timelines)
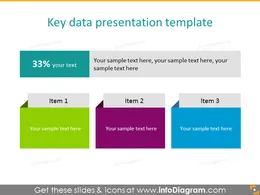
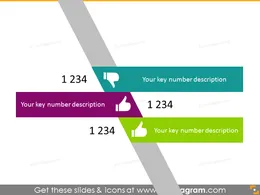
* Infographics for presenting KPIs, key data and values [ (Slideshare presentation) ](http://www.slideshare.net/infoDiagram/infographics-slides-key-data-kpi-presentation-ppt-infodiagrampart3)
Fully editable vector shapes by using built-in PowerPoint tools (vector format), including * changing contour color of the icon * changing color of the scribble filling * adding shadows * changing shape and size, rotating, flipping the object * putting shapes behind or on top of text See editing demonstration in our HowTo Videos.
Content and design: Izabela Zvirinska * Contact via infoDiagram.com
Vos graphiques ajoutent une belle touche à mes présentations et je les ai récemment utilisés pour l'une de mes réunions générales. Votre boîte à outils ajoute du professionnalisme à mes diapositives. Au lieu d'utiliser des cliparts standards.
Claude Jones, Directeur de l'ingénierie, @Walmartlabs, USA
J'avais besoin d'un nouveau regard sur certaines de mes diapositives. J'ai essayé de trouver un moyen de créer un effet de pinceau, de souligner, d'accentuer, d'ajouter de la couleur et les marqueurs manuscrits étaient exactement ce qu'il fallait. Très facile à utiliser, facile à ajuster la taille, à changer la couleur. C'était une solution abordable et parfaite et je suis heureux de la recommander.
Anonymous, US
L'aspect net et épuré des graphiques, et le fait qu'il m'ait permis d'éditer et de changer facilement les couleurs pour les adapter au modèle, ont été les principales raisons de mon achat.
Brandie Jenkins, Développeur E-learning, USA


You may also need