
Your graphics add a nice touch to my presentations and I recently used them for one of my all-hands meetings. Your toolbox adds professionalism to my slides. Instead of using standard clipart.
Claude Jones, Director of Engineer, @Walmartlabs, USA

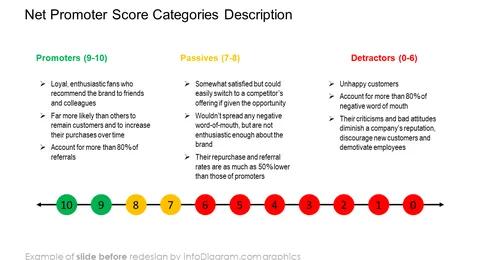
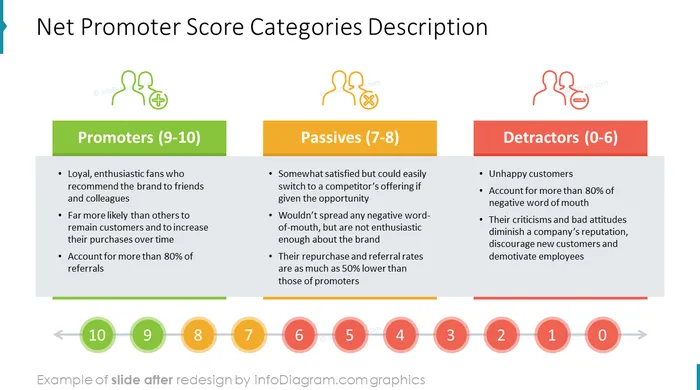
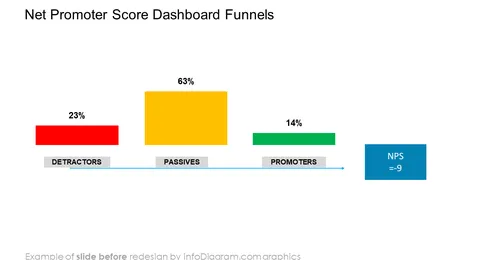
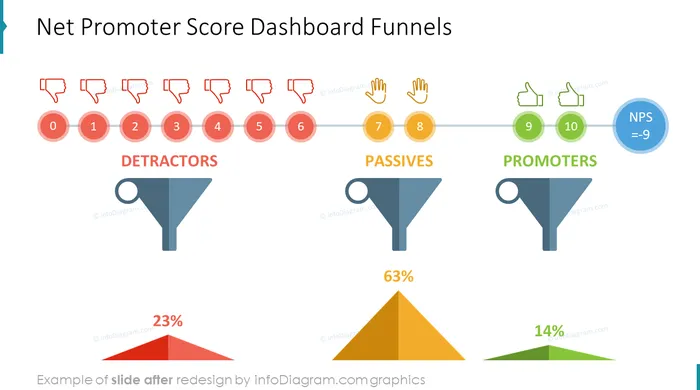
Before and after

Are you looking for a useful metric for gauging customer loyalty? Want to show your customers' satisfaction level and the drivers behind their willingness to recommend your products or services? Use our creative graphical charts and iconographic graphs to help your audience understand the Net Promoter Score's importance through compelling visualizations.
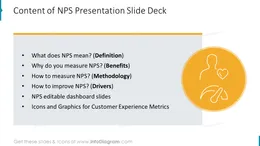
This Net Promoter Score Template contains visual slides with:
Format: fully editable vector shapes (modify colors of diagrams and icons, resize without quality loss)
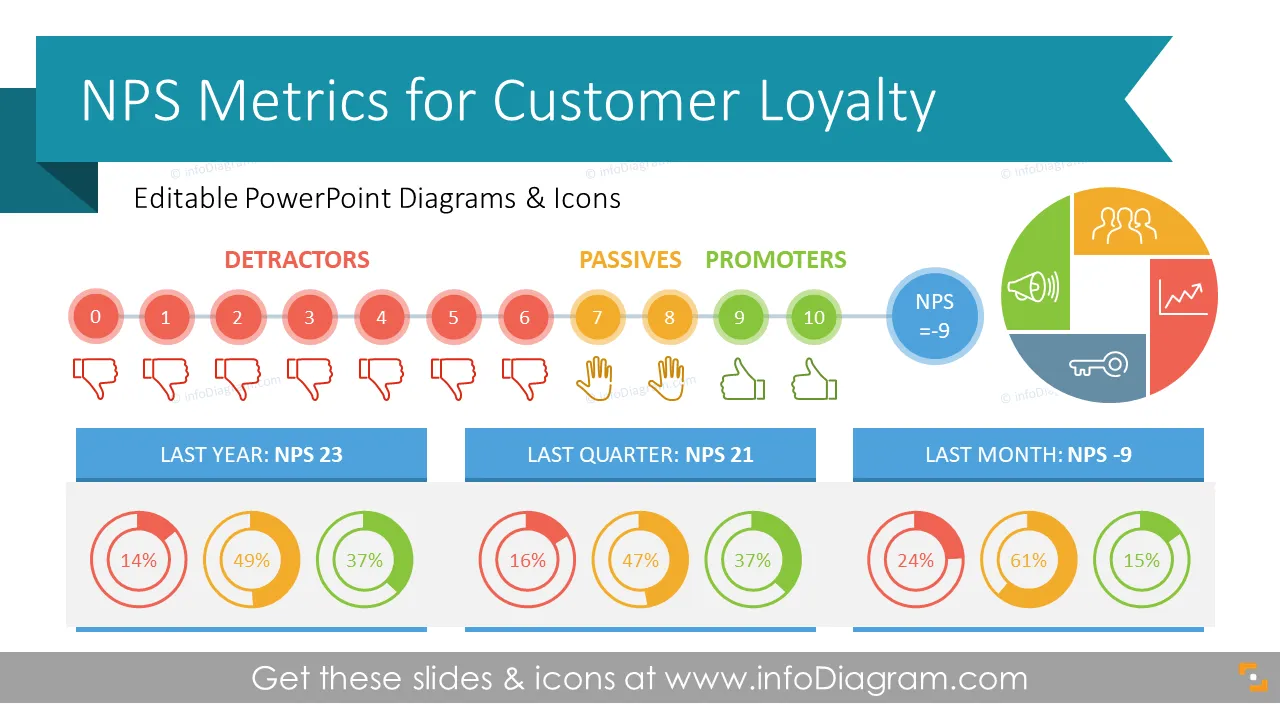
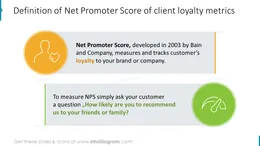
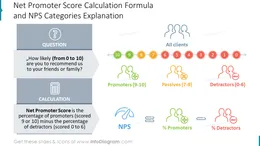
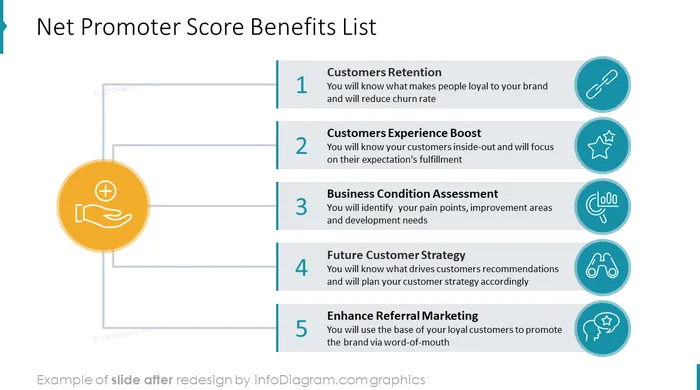
Net Promoter Score (NPS) measures customers' willingness to recommend your products or services to others. It’s the most common way to measure customer satisfaction and loyalty in a systematic manner. NPS scores are measured with a single-question survey and reported with a number from -100 to +100. A higher score indicates a better loyalty level.
Net Promoter Score formula calculates the percentage of promoters (scored 9 or 10) minus the percentage of detractors (scored 0 to 6). The score is based on answering simple questions asking customers to rank how likely they are to recommend a service or product.
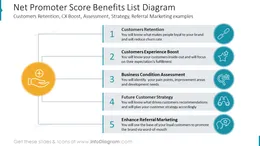
If you want to clearly summarize your NPS Score, show counts or percentages of Promoters, Passives, and Detractors within the NPS metric, or present tracking customer loyalty over time we have ready-to-use infographics for that.
You can reuse our graphs and charts and tailor them to your needs in order to upgrade your presentation slides.
Using infographics and chart graphs will help you organize information in a good-looking way and present your numbers and comparisons visually.
Try using those PowerPoint illustrations to present your content visually in an elegant way.
All graphics are editable, so you can modify the colors and text. We also added a general icon collection at the end of the presentation deck. Optionally you can also extend the collection by more PPT symbols (see Related Diagrams section).
Fully editable in PowerPoint set of vector shapes fully editable by using built-in PowerPoint tools, including
See the editing demonstration in our HowTo Videos.
Your graphics add a nice touch to my presentations and I recently used them for one of my all-hands meetings. Your toolbox adds professionalism to my slides. Instead of using standard clipart.
Claude Jones, Director of Engineer, @Walmartlabs, USA
I needed a fresh look at some of my slides. I've tried to find a way to create a paintbrush effect, to underline, accentuate, add some color and the handwritten markers were just the things. Very easy to use, easy to size, change the color. It was an affordable, perfect solution and I'm happy to recommend it.
Anonymous, US
The crisp, clean look of the graphics, and the fact that it allowed me to easily edit and change the colors to match the template was my main reason for purchasing them.
Brandie Jenkins, E-learning Developer, USA


You may also need