
Cover and narrative setup

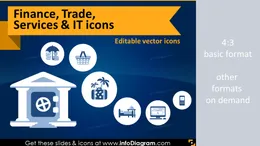
Deck preview
This template does not have a dedicated before/after case study, so we show the strongest slides from the actual deck instead.
Cover and narrative setup
Core structure and talking points
Polished visual slide from the deck
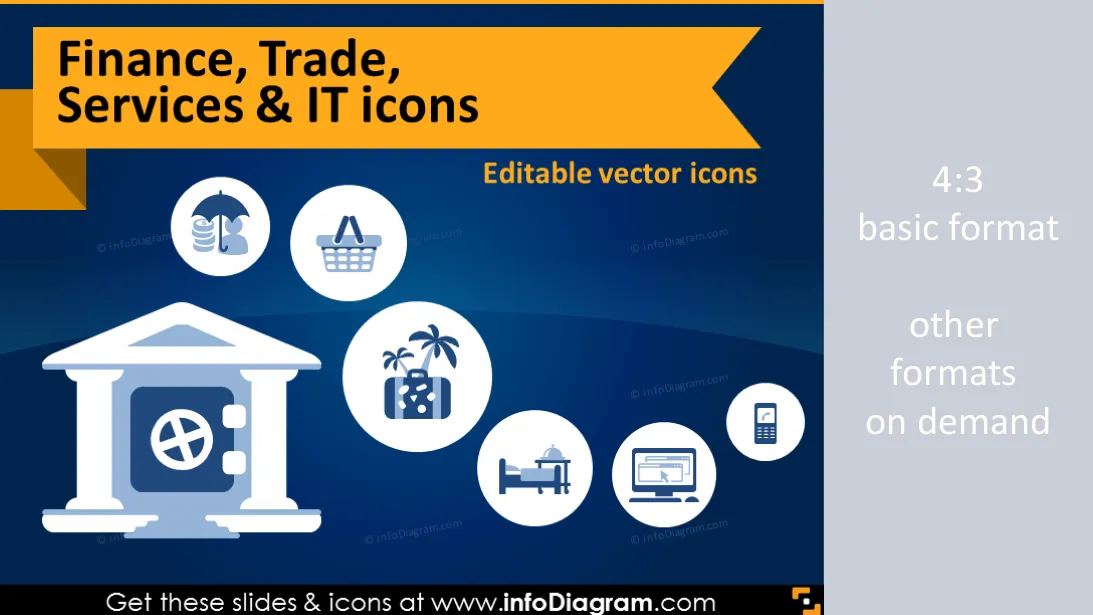
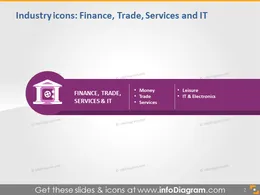
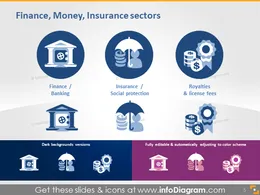
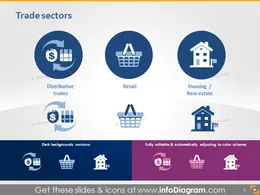
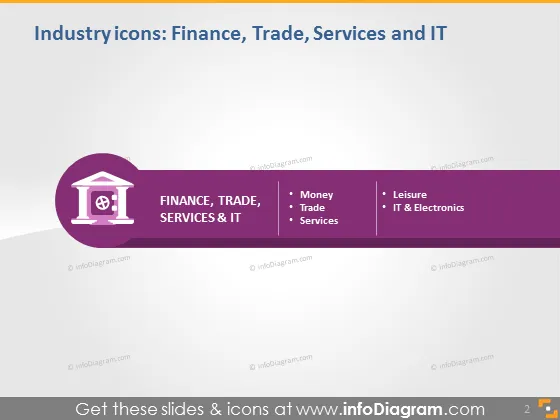
Industry Symbols for PowerPoint. Finance, Trade, Services and IT industry segments pictograms:
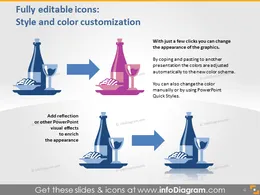
Icons for visualizing economical and industry specific topics. All symbols are as clipart pictures - fully editable in PowerPoint.
Package content:
Finance industry icons: Banking, Money, Insurance, Royalties symbols
Trade industry icons: Retail, Housing and Real Estate, Distributive trades symbols
Service industry icons: Entertainment, Marketing, Repair, Business Services symbols
Transport and Travel segment icons: Airplane transport, Hotel, Tourism symbols
Leisure segment icons: Restaurant, Recreation symbols
IT and electronics icons: Software, Hardware, Telecommunication, Information technology symbols
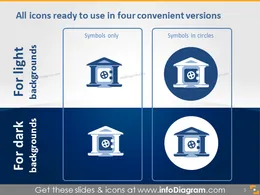
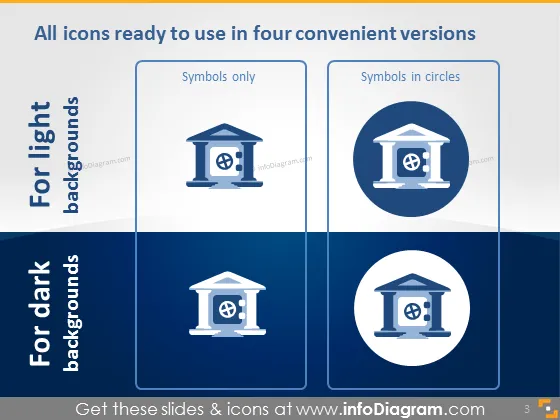
All icons in simple flat style, suitable for Metro UI style graphics.. Icons provided in 4 versions:
Fully editable in PowerPoint set of vector shapes fully editable by using built-in PowerPoint tools, including
See editing demonstration in our HowTo Videos.
Vos graphiques ajoutent une belle touche à mes présentations et je les ai récemment utilisés pour l'une de mes réunions générales. Votre boîte à outils ajoute du professionnalisme à mes diapositives. Au lieu d'utiliser des cliparts standards.
Claude Jones, Directeur de l'ingénierie, @Walmartlabs, USA
J'avais besoin d'un nouveau regard sur certaines de mes diapositives. J'ai essayé de trouver un moyen de créer un effet de pinceau, de souligner, d'accentuer, d'ajouter de la couleur et les marqueurs manuscrits étaient exactement ce qu'il fallait. Très facile à utiliser, facile à ajuster la taille, à changer la couleur. C'était une solution abordable et parfaite et je suis heureux de la recommander.
Anonymous, US
L'aspect net et épuré des graphiques, et le fait qu'il m'ait permis d'éditer et de changer facilement les couleurs pour les adapter au modèle, ont été les principales raisons de mon achat.
Brandie Jenkins, Développeur E-learning, USA


You may also need