

Your graphics add a nice touch to my presentations and I recently used them for one of my all-hands meetings. Your toolbox adds professionalism to my slides. Instead of using standard clipart.
Claude Jones, Director of Engineer, @Walmartlabs, USA

Your graphics add a nice touch to my presentations and I recently used them for one of my all-hands meetings. Your toolbox adds professionalism to my slides. Instead of using standard clipart.
Claude Jones, Director of Engineer, @Walmartlabs, USA
I needed a fresh look at some of my slides. I've tried to find a way to create a paintbrush effect, to underline, accentuate, add some color and the handwritten markers were just the things. Very easy to use, easy to size, change the color. It was an affordable, perfect solution and I'm happy to recommend it.
Anonymous, US
The crisp, clean look of the graphics, and the fact that it allowed me to easily edit and change the colors to match the template was my main reason for purchasing them.
Brandie Jenkins, E-learning Developer, USA
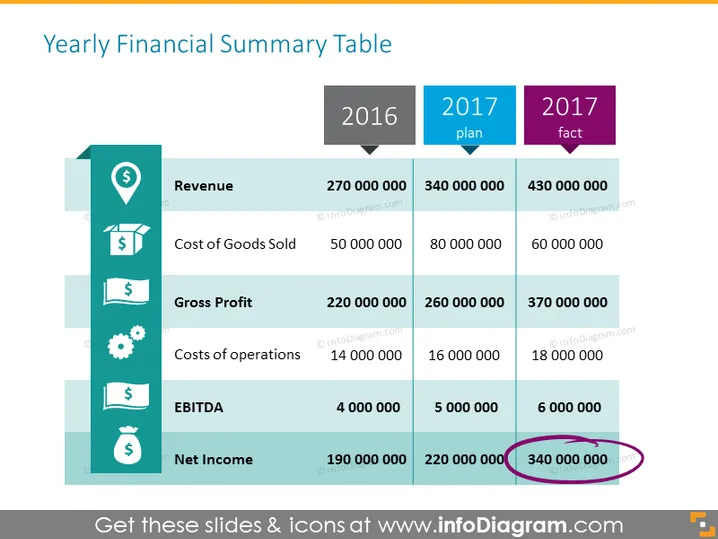
The slide presents a comparative financial summary for the years 2016 and 2017, including planned versus actual figures for 2017. It compares Revenue, Cost of Goods Sold, Gross Profit, Costs of operations, EBITDA, and Net Income across three columns. Each financial metric shows a significant increase in actual 2017 figures compared to both 2016 and 2017 plans, indicating growth and perhaps surpassing projections. Gross Profit rose from 220 million in 2016 to 370 million in 2017 actual, showing effective revenue management. EBITDA and Net Income metrics are also highlighted, with actual 2017 figures exceeding the plan; particularly, Net Income saw a jump to 340 million, circled to emphasize its significance.
The slide features a clear, professional layout with a color-coded system and icons to easily differentiate between financial metrics. The use of alternating row colors enhances readability, and the additional graphical highlight on the key figure of Net Income helps focus attention on the most noteworthy data point.



