Your graphics add a nice touch to my presentations and I recently used them for one of my all-hands meetings. Your toolbox adds professionalism to my slides. Instead of using standard clipart.
Claude Jones, Director of Engineer, @Walmartlabs, USA
Your graphics add a nice touch to my presentations and I recently used them for one of my all-hands meetings. Your toolbox adds professionalism to my slides. Instead of using standard clipart.
Claude Jones, Director of Engineer, @Walmartlabs, USA
I needed a fresh look at some of my slides. I've tried to find a way to create a paintbrush effect, to underline, accentuate, add some color and the handwritten markers were just the things. Very easy to use, easy to size, change the color. It was an affordable, perfect solution and I'm happy to recommend it.
Anonymous, US
The crisp, clean look of the graphics, and the fact that it allowed me to easily edit and change the colors to match the template was my main reason for purchasing them.
Brandie Jenkins, E-learning Developer, USA
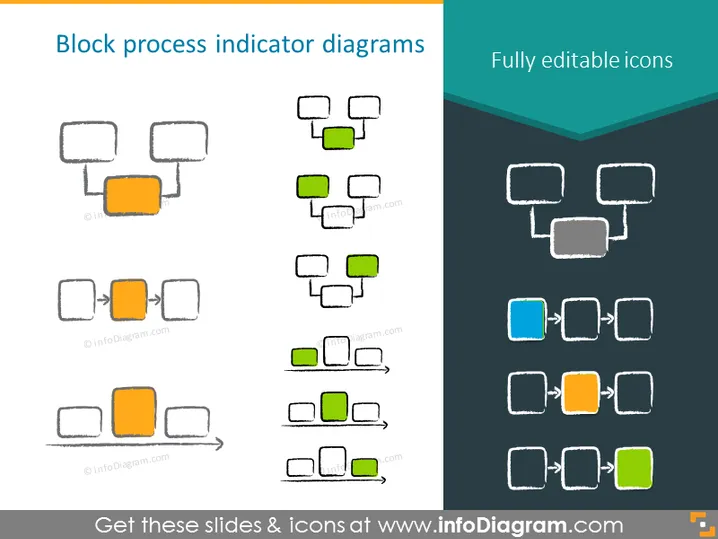
The PowerPoint slide depicts various "Block process indicator diagrams," which are essentially flowcharts or sequences of steps involving rectangular blocks. These blocks are connected by arrows indicating the flow or order of processes. The diagrams vary in the number of steps and configurations, demonstrating the versatility of such diagrams in representing processes. Some are linear while others branch out, and the highlighted (colored) blocks suggest a focus on specific stages or key processes within the overall sequence.
The overall look of the slide is relatively simple, with a clean and organized appearance that allows the viewer to focus on the stepwise flow illustrated by the diagrams. The sketched style adds an element of informality and ease which might make the content more approachable.


