The Plastic Pollution Presentation can be used when you want to explain plastics pollution and its effects topic, talk about waste awareness, and present action plans. Every day approximately 8 million pieces of plastic find their way into our oceans and become a part of our food chain. If you want to persuade your company to take steps toward a more sustainable economy, use graphics to make data more user-friendly to read and therefore focus your audience's attention on the problem.
We have designed this PPT slide deck to support you in explaining the reasons why we should care about plastic garbage and what businesses and individuals can do to take action against it.
This Plastic Pollution and Waste Infographics collection for PPT contains:
- 21 diagrams showing the statistics of plastic pollution and global waste, pollution contributors, actions we can take to tackle plastic pollution and reduce plastic in our daily lives, and ways to increase employee engagement in recycling. You can use these graphics to turn your ideas into graphics, creatively present complex solutions connected with the plastic pollution problem, and reach harmony in the slide design.
- Modern flat infographics style is eye-catching, readable, and universal to add to any presentation style.
- Extensive icon set of 58 outline symbols on global plastic climate themes and plastic pollutants such as Earth, Planet, Globe, Care, Coastal Waste, Polluted Ocean, Nature, Trees, Landfill, Trash Bin, Reusing, Ecology, Eco Solutions, Nature.
- Instruction on how to modify those diagrams using standard PowerPoint editing tools
Format: fully editable vector shapes (modify colors of diagrams and icons, resize without quality loss).
What is Plastic Pollution & Waste Infographics?
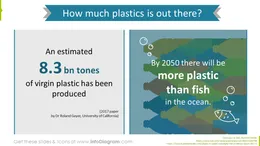
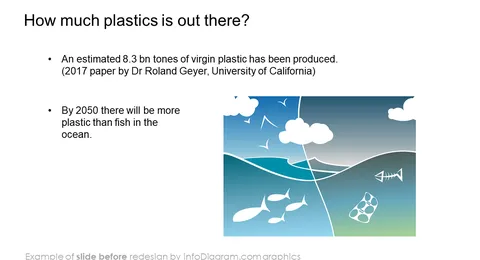
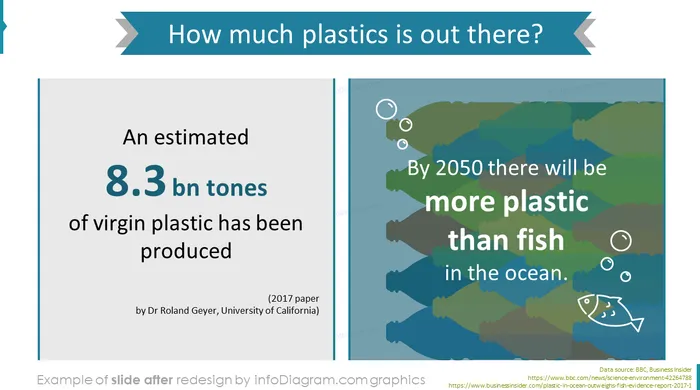
Plastic pollution has become one of the most urgent environmental issues, as rapidly increasing the production of disposable plastic products impacts the world's ability to deal with them. The numbers are shocking: by 2050 there will be more plastic than fish in the ocean.
We designed a set of Plastic Pollution & Waste Infographics to help you illustrate the effects of plastic pollution if you're working on a climate-related study and need to create readable catchy visuals. You can save time designing the slides as we organized the information in a way that will keep your listeners attentive and aware.
Where you can use Plastic Pollution & Waste Infographics?
Using diagram visualizations while talking about climate-related issues, specifically plastic pollution is a way to decrease the number of slides by cutting the text and increasing the number of visually-attractive infographics. Diagrams will give you the possibility to collate all the data in precise minimum slides.
- Start with the explanation of the reasons we should care about plastic junk and support your words with numbers.
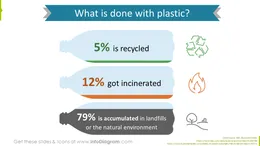
- Illustrate the number of plastics recycled, incinerated, and accumulated in the environment and the number of involuntary consumed plastic each year.
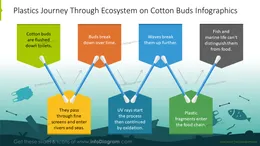
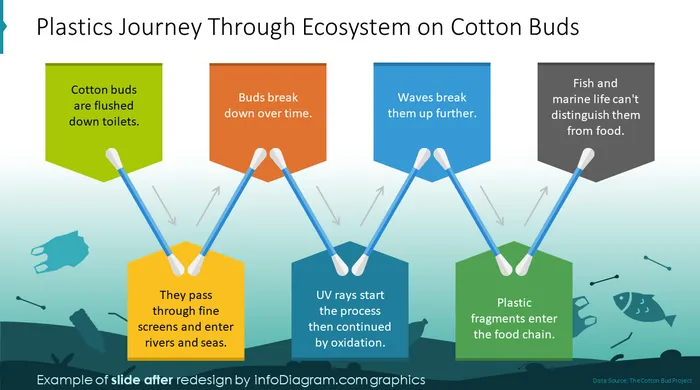
- Create a visual example of the plastic's journey through the ecosystem on cotton buds example.
- Show where the plastic we take in comes from and what happens with it after its disposal.
- Present the statistics on the pollution problem: the number of plastic entering the world's oceans, estimated minimum and the maximum time taken to decompose on the example of various consumer goods.
- Illustrate plastic pollution contributors and average plastic use.
- Compare plastic recycling rates around the world.
- Visualize actions we can take against plastic junk: Introduce the Refuse, Reuse, Reduce, Recycle prevention concept, waste segregation, ways to decrease plastic in everyday life, and ways to increase employee engagement in recycling.
Try using those PowerPoint illustrations to present your content visually in an elegant way.
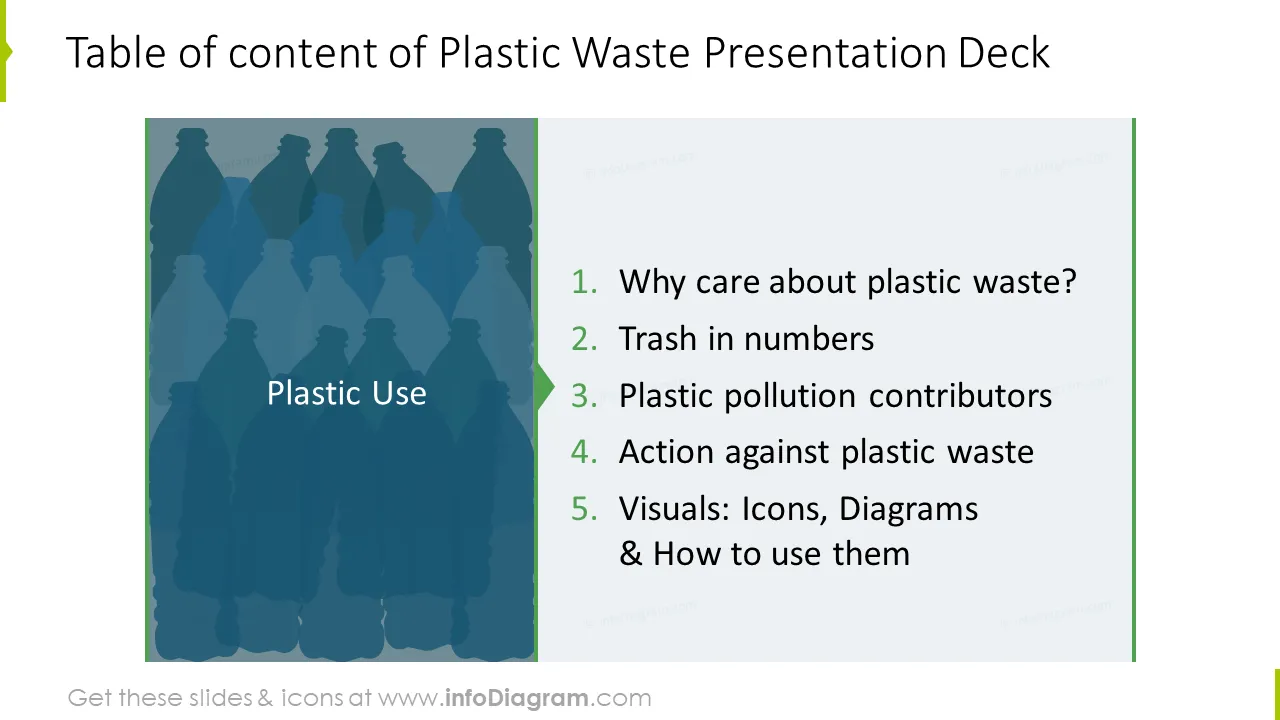
Plastic waste slides collection contains pre-designed slides:
* Table of content of the plastic waste slide
* How much plastic is produced and the results of our utilization of infographics
* Plastics recycled in the environment depicted in the data statistics diagram
* Plastics journey through ecosystem on cotton buds graphics
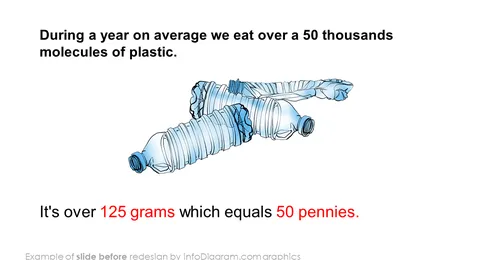
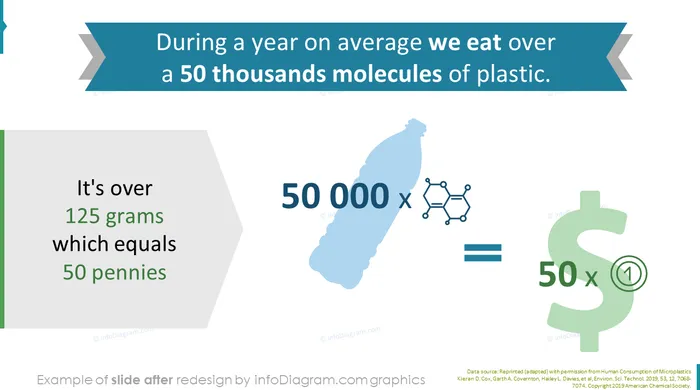
* How much plastic do we involuntary consume showed with pollution fact
* Plastic use sources infographics
* Plastic packaging reuse shown with data graphics
* Plastic enters the world's oceans illustrated by ocean pollution data chart
* Chart presenting the time it takes to decompose plastics
* Sea trash type statistics
* Bottled water global vs America consumption statistics
* Plastic Bottle water sold and recycled statistics iconography
* Average plastic consumption infographics comparing the USA and Denmark's yearly plastic bag usage per resident
* Plastic recycling rates graphics in the world - US, Europe, China
* Plastic pollution prevention graphics - 4R: Refuse, Reuse, Reduce, Recycle
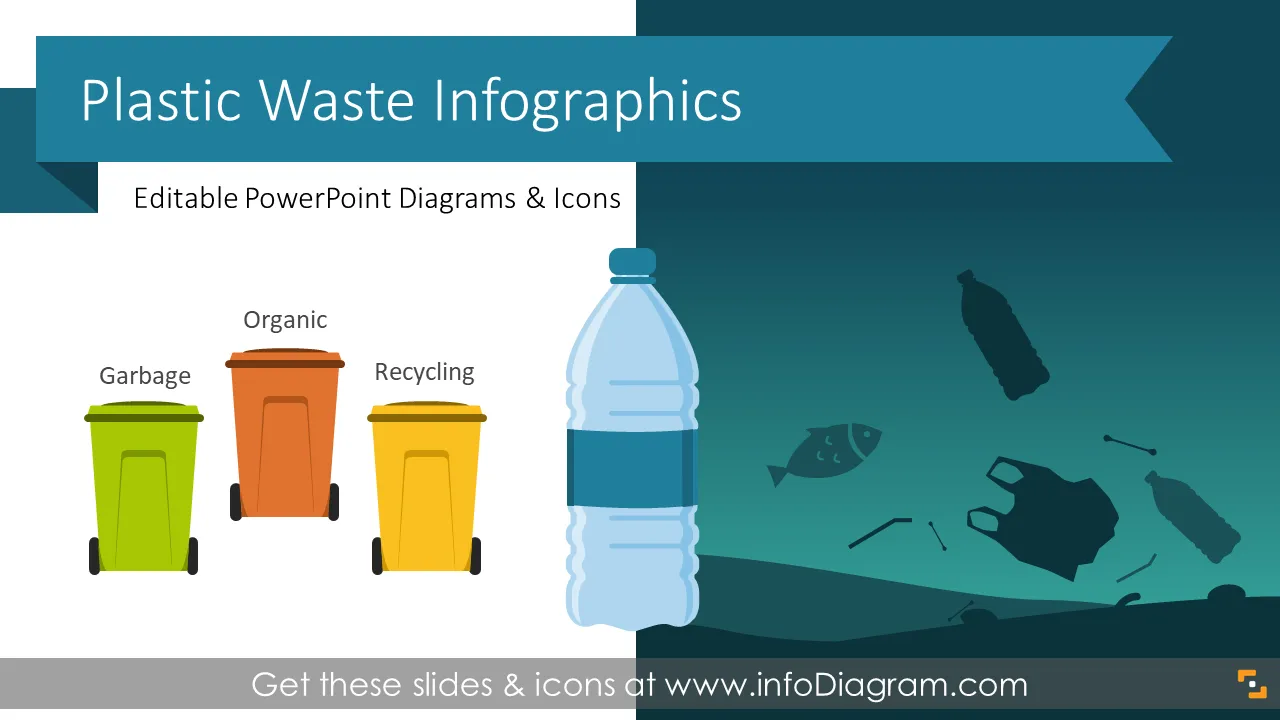
* Waste segregation showed with three and five bins template
* Ways to reduce plastic shown with list infographics
* Ways to increase employee engagement in recycling ideas diagram
* Plastics pollution mitigation project actions timeline
All graphics are editable, so you can modify the colors and text. We added also a general icon collection at the end of the presentation deck. Optionally you can also extend the collection by more PPT symbols (see Related Diagrams section).
Further information sources on Climate Change
Fully editable in PowerPoint set of vector shapes fully editable by using built-in PowerPoint tools, including
- change the color of all shapes filling and their outline, including icons
- adding shadows
- changing shape and size, rotating, flipping the object
- putting shapes behind or on top of text
See editing demonstration in our HowTo Videos.
Authors
- infoDiagram's designer
- Contact: here
Slides included in this PowerPoint Presentation:
- Table of content of plastic waste deck
- Why should we care about plastic waste?
- How much plastic is there - infographics with statistics
- Plastic Waste Management - Plastic Pollution PPT Template
- Plastics Journey Through Ecosystem - Plastic Pollution PPT
- How much plastic do we involuntary consume showed with pollution fact
- Plastic Consumption Statistics - Plastic Waste Statistics Template
- Plastic packaging reuse showed with data graphics
- Trash in numbers slide
- Ocean Pollution Data - Plastic Pollution Dataset
- Plastic Decomposition Graph - Plastic Pollution Infographics
- Sea waste type statistics
- Plastic pollution contributors slide
- Bottled water global vs America consumption statistics
- Bottled water sold and recycled statistics iconography
- Average plastic consumption infographics
- Plastic recycling rates graphics
- Action against plastic waste slide
- Plastic pollution prevention graphics
- Waste segregation showed with three bins template
- Waste segregation showed with five bins infographics
- Ways to reduce plastic showed with list infographics
- Ways to reduce plastic showed with list infographics
- Ways to increase employee engagement in recyclingideas diagram
- Plastics pollution mitigation project actions timeline
- All shapes are easy to adapt
- Editability of outline icons in PowerPoint
- Outline style icons set: earth, planet, globe, care, coast,
- Outline style icons set: plastic bottle, plastic bag, ear buds
- Outline style icons set: arrows, trash bin, waste, garbage, reuse
- Outline style icons set: comment, feedback, talk, presentation
- Outline style icons set: factory, manufacturing, shopping bag, package