

Cover and narrative setup
Deck preview
This template does not have a dedicated before/after case study, so we show the strongest slides from the actual deck instead.
Cover and narrative setup
Core structure and talking points
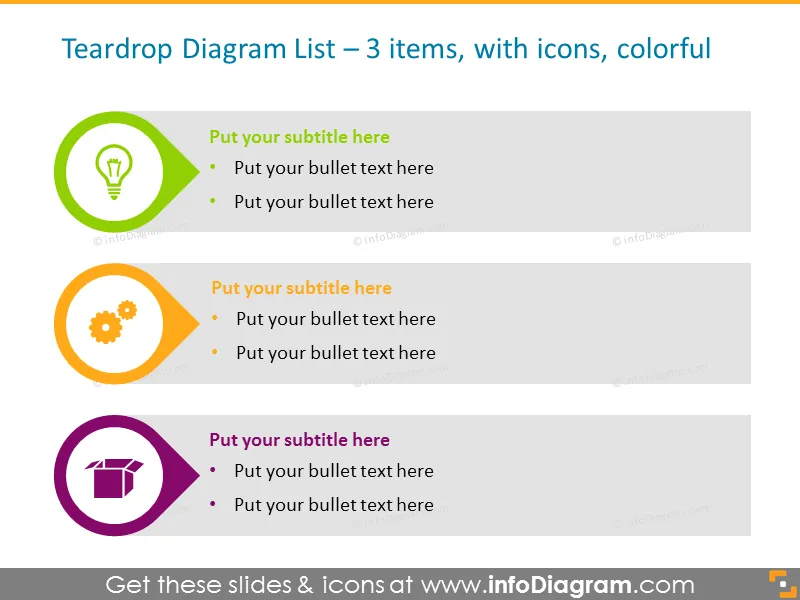
Polished visual slide from the deck
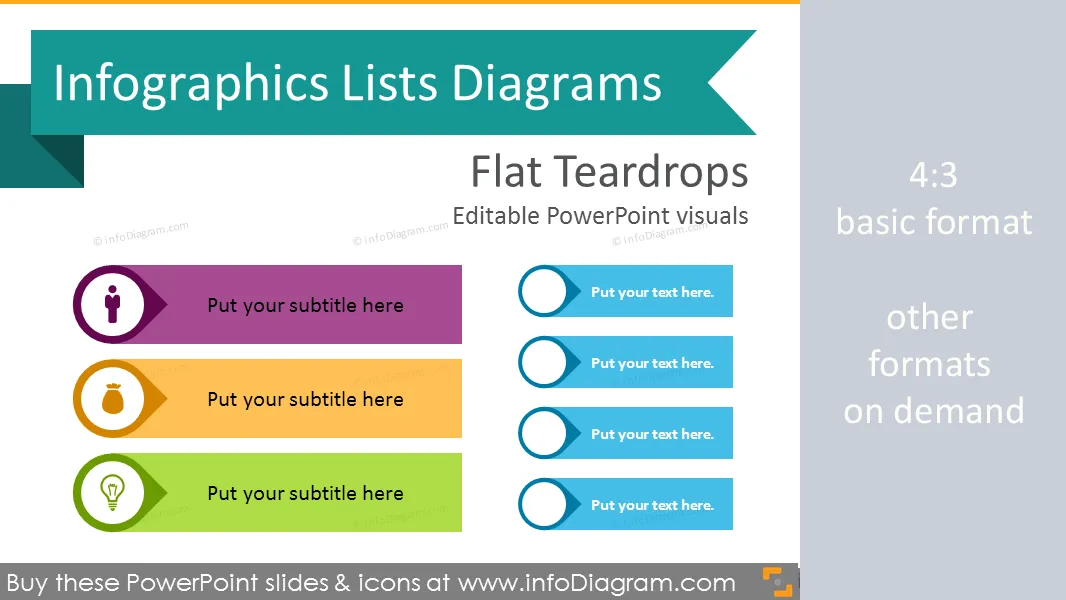
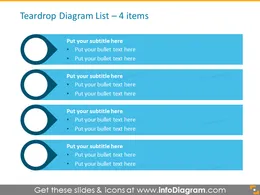
Set of item lists diagrams to replace bulletpoints by visual infographics made in Powerpoint
Diagrams and symbols for creating modern style infographics presentation in Powerpoint.
Infographics Teardrops Lists template is a set of item lists diagrams to replace bullet points with visual infographics made in Powerpoint. It includes 10 variations of flat diagrams, text placeholders, set of various universal icon symbols. Thanks to these layouts you can make your slides colorful and eye-catchy.
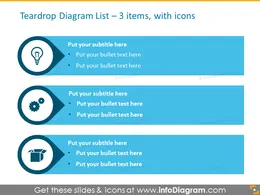
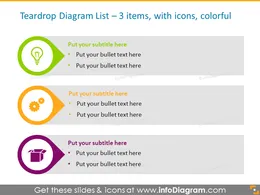
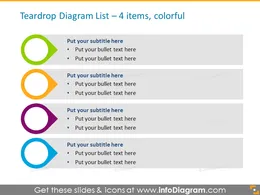
Teardrops list template will help you to create projects plans, TODO lists, priority checklists. The presented PowerPoint template will serve you for visualizing large amounts of data in the most accurate and efficient manner. These layouts will help keep the slide simple balanced with enough details. You can also apply your brand colors and make a visually attractive design.
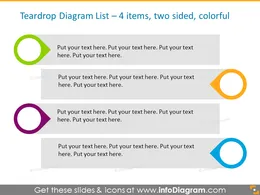
Teardrop lists will be a handy assistant for your investor pitches, market research reports, HR or strategy planning presentations. You can add as many items as you need, with or without text boxes, place them in two columns and rows, placing strictly one below another or in cascade.
Using the template, you can also apply a combination of arrows and circles together. This is a really good way to design eye-catchy slides without special knowledge and effort.
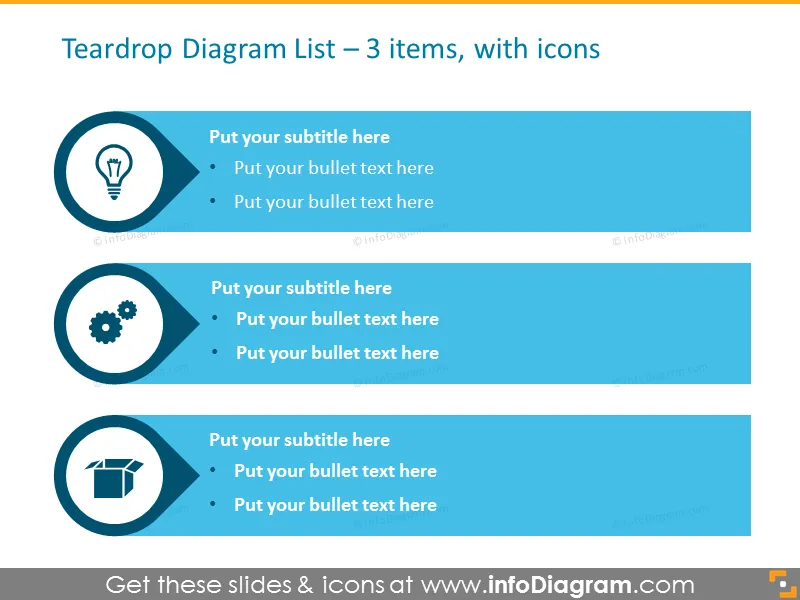
We added icons set, which includes: human, thumbs up, a magnifier to illustrate analysis or search concept, target or bullseye to show objectives and goals concept, calendar, institution, mobile telephone, data chart symbols. Additionally, you can enrich the main points of your list by adding a symbol to each item.
All shapes can be edited using PowerPoint set of vector shapes fully editable by using built-in PPT tools, including
See editing demonstration in our HowTo Videos.
Your graphics add a nice touch to my presentations and I recently used them for one of my all-hands meetings. Your toolbox adds professionalism to my slides. Instead of using standard clipart.
Claude Jones, Director of Engineer, @Walmartlabs, USA
I needed a fresh look at some of my slides. I've tried to find a way to create a paintbrush effect, to underline, accentuate, add some color and the handwritten markers were just the things. Very easy to use, easy to size, change the color. It was an affordable, perfect solution and I'm happy to recommend it.
Anonymous, US
The crisp, clean look of the graphics, and the fact that it allowed me to easily edit and change the colors to match the template was my main reason for purchasing them.
Brandie Jenkins, E-learning Developer, USA


You may also need