
Cover and narrative setup

Deck preview
This template does not have a dedicated before/after case study, so we show the strongest slides from the actual deck instead.
Cover and narrative setup

Core structure and talking points
Infographics presentation template and graphical elements
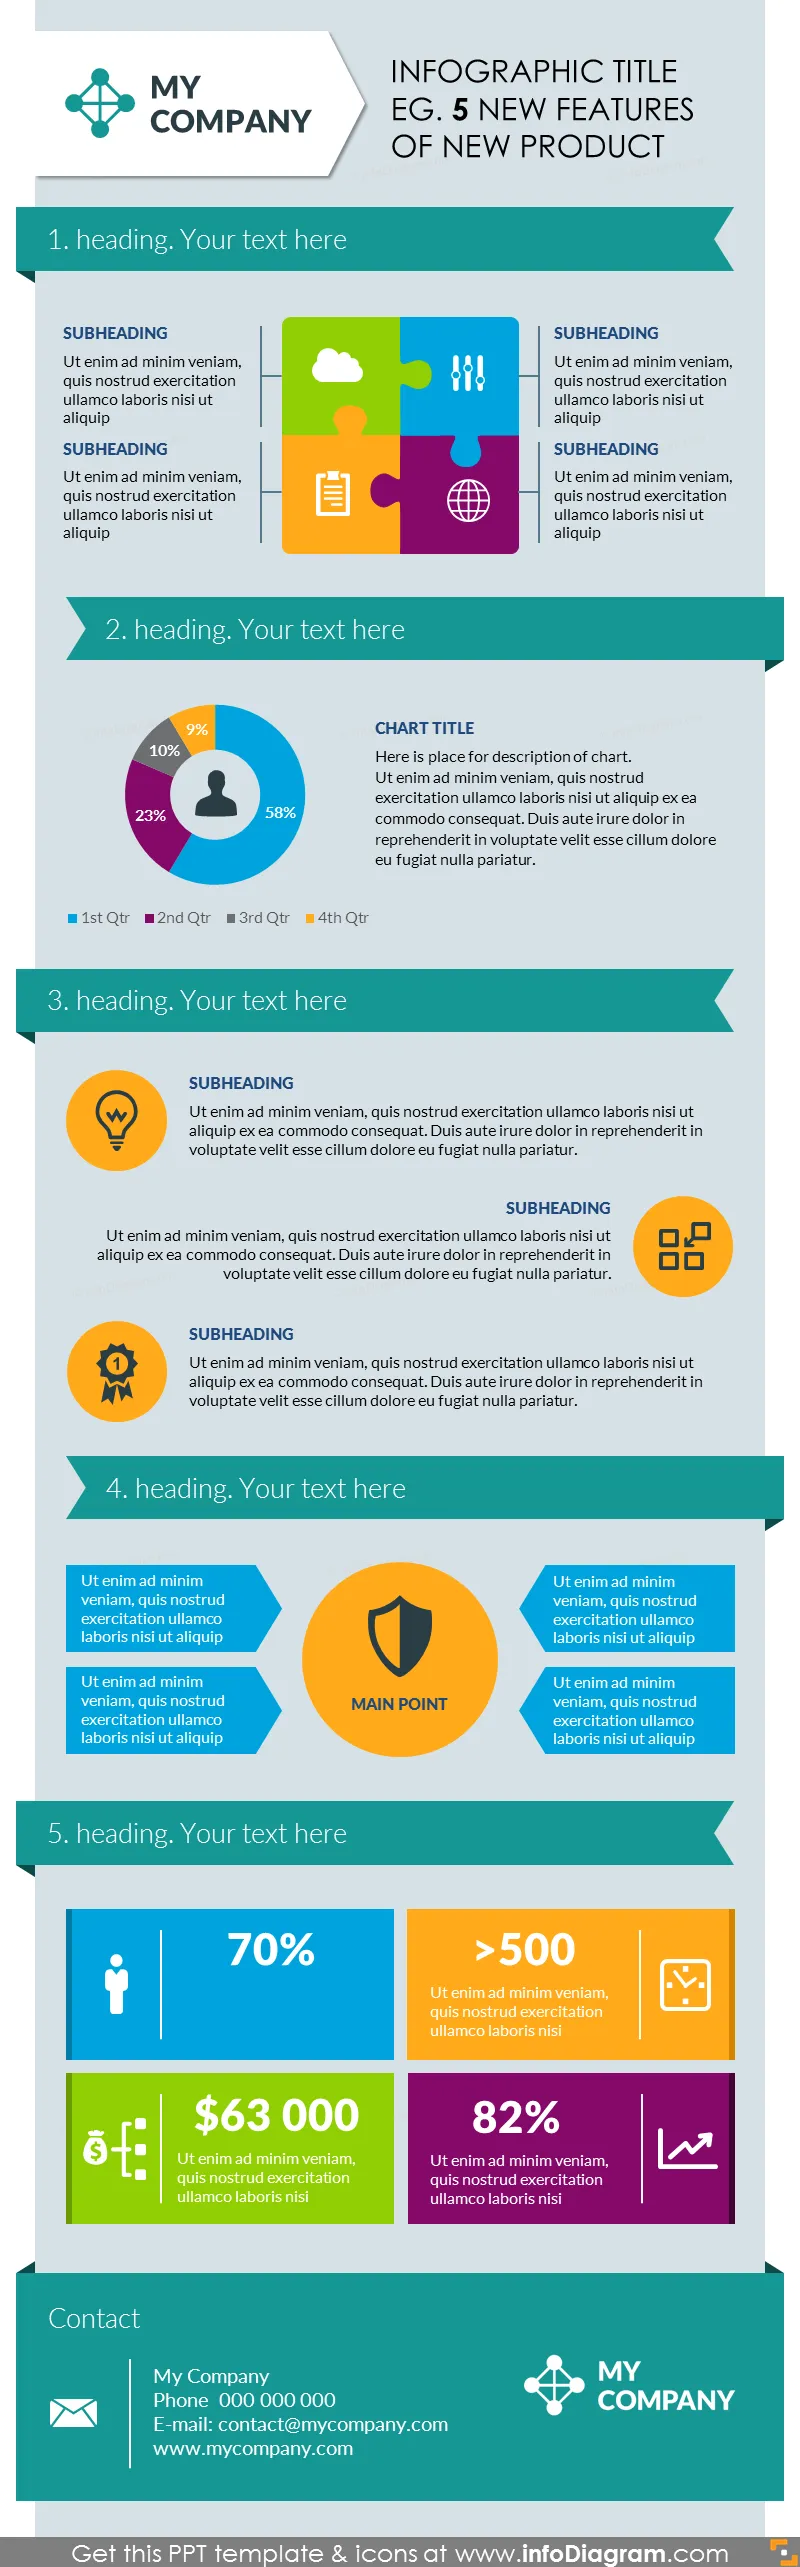
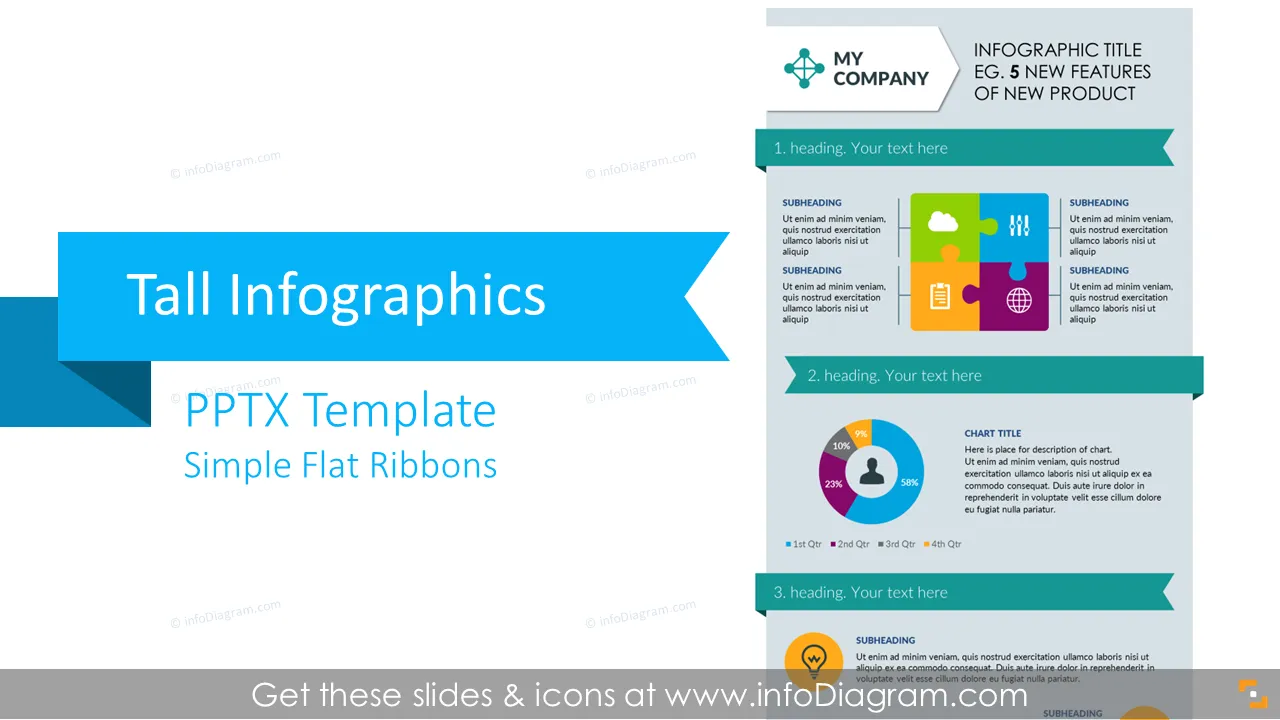
Template for creating tall size infographics in PowerPoint.
You can use the template to design a simple infographics and export is as a picture to be added to your webpage, blog or social media channels.
Suggestions for infographics use:
Create simple and persuasive presentation with these editable icons and diagrams. Get rid of heavy texts and boring financial data, replace it with pre-designed template for PowerPoint
All shapes can be edited using PowerPoint set of vector shapes fully editable by using built-in PPT tools, including
See editing demonstration in our HowTo Videos.
Vos graphiques ajoutent une belle touche à mes présentations et je les ai récemment utilisés pour l'une de mes réunions générales. Votre boîte à outils ajoute du professionnalisme à mes diapositives. Au lieu d'utiliser des cliparts standards.
Claude Jones, Directeur de l'ingénierie, @Walmartlabs, USA
J'avais besoin d'un nouveau regard sur certaines de mes diapositives. J'ai essayé de trouver un moyen de créer un effet de pinceau, de souligner, d'accentuer, d'ajouter de la couleur et les marqueurs manuscrits étaient exactement ce qu'il fallait. Très facile à utiliser, facile à ajuster la taille, à changer la couleur. C'était une solution abordable et parfaite et je suis heureux de la recommander.
Anonymous, US
L'aspect net et épuré des graphiques, et le fait qu'il m'ait permis d'éditer et de changer facilement les couleurs pour les adapter au modèle, ont été les principales raisons de mon achat.
Brandie Jenkins, Développeur E-learning, USA


You may also need