Your graphics add a nice touch to my presentations and I recently used them for one of my all-hands meetings. Your toolbox adds professionalism to my slides. Instead of using standard clipart.
Claude Jones, Director of Engineer, @Walmartlabs, USA
Your graphics add a nice touch to my presentations and I recently used them for one of my all-hands meetings. Your toolbox adds professionalism to my slides. Instead of using standard clipart.
Claude Jones, Director of Engineer, @Walmartlabs, USA
I needed a fresh look at some of my slides. I've tried to find a way to create a paintbrush effect, to underline, accentuate, add some color and the handwritten markers were just the things. Very easy to use, easy to size, change the color. It was an affordable, perfect solution and I'm happy to recommend it.
Anonymous, US
The crisp, clean look of the graphics, and the fact that it allowed me to easily edit and change the colors to match the template was my main reason for purchasing them.
Brandie Jenkins, E-learning Developer, USA
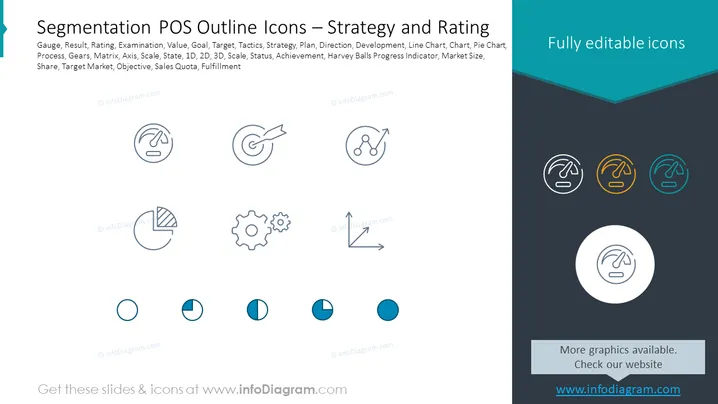
The slide showcases a collection of outline icons related to business strategy and performance measurement, including Gauge, Result, Rating, and so forth. These icons represent various concepts such as: Gauge (measuring performance), Result (outcome display), Rating (assessment scale), Examination (detailed analysis), Value (worth or importance), and Goal (aim or objective). Other concepts like Tactics, Strategy, Plan, and Direction imply methods and pathways for achieving business objectives. Icons for Development, various charts (Line, Pie), and Process indicate methods of progress tracking and workflow management. Additional concepts like Gears (mechanics of operation), Matrix, Axis, Scale, States (1D, 2D, 3D), and Status describe frameworks for analysis. Achievement, Harvey Balls Progress Indicator, Market Size, Share, Target Market, Objective, Sales Quota, and Fulfillment icons round out the collection, symbolizing success metrics and target setting in a business context.
The slide provides a neat and visually balanced presentation, with a clear focus on the icons themselves. The division of space and the contrast between the white and dark blue sections create an engaging backdrop for the content.


