Resources, energy & agriculture + Public sector, science & culture index of icons—shapes on filled circles
Slide Content
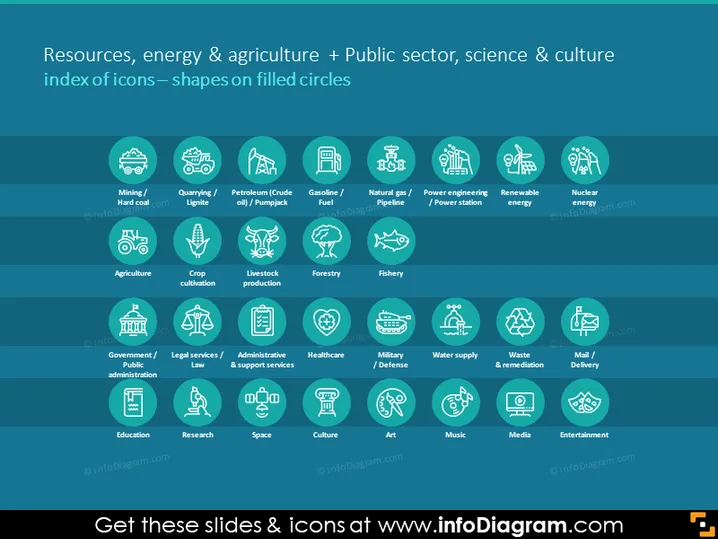
The slide presents a comprehensive collection of icons arranged in a grid layout, each category labeled appropriately to represent various sectors. The sectors include "Mining / Hard coal", "Quarrying / Lignite", and several energy-related icons such as "Petroleum (Crude oil) / Pumpjack", "Gasoline / Fuel", "Natural gas / Pipeline", "Power engineering / Power station", "Renewable energy", and "Nuclear energy". Additionally, agricultural topics are displayed: "Agriculture", "Crop cultivation", "Livestock production", "Forestry", "Fishery". The slide also comprises public sector icons: "Government / Public administration", "Legal services / Law", "Administrative & support services", "Healthcare", "Military / Defense", "Water supply", "Waste & remediation", "Mail / Delivery". There are icons for education and culture sectors, including "Education", "Research", "Space", "Culture", "Art", "Music", "Media", and "Entertainment".
Graphical Look
- The PowerPoint slide uses a dark blue background that contrasts with neon green and white icons and text.
- The slide features a grid layout with four rows and six columns, neatly organizing the various icons.
- Each icon is placed on a neon green filled circle to create a visually distinct badge or button appearance.
- The icons are simple line art designs, white in color, representing different facets of resources, energy, agriculture, public sector, science, and culture.
- The text labels are white and positioned directly beneath each icon for clear sector identification.
- The slide uses a blend of sans-serif fonts for readability and modern feel.
The slide maintains a professional and visually clean appearance with a harmonious color scheme that emphasizes the icons. The consistent iconography and layout provide an easy-to-digest visual categorization of different sectors.
Use Cases
- The slide could be used in a presentation to illustrate the breadth of industries and services within an economy.
- It can be utilized for educational purposes to teach about various sectors and their corresponding activities or resources.
- Businesses can use the slide during meetings to discuss potential sectors for investment or expansion.
- The slide would be beneficial in government or policy presentations to signify areas of focus, interest, or regulation.