Your graphics add a nice touch to my presentations and I recently used them for one of my all-hands meetings. Your toolbox adds professionalism to my slides. Instead of using standard clipart.
Claude Jones, Director of Engineer, @Walmartlabs, USA
Your graphics add a nice touch to my presentations and I recently used them for one of my all-hands meetings. Your toolbox adds professionalism to my slides. Instead of using standard clipart.
Claude Jones, Director of Engineer, @Walmartlabs, USA
I needed a fresh look at some of my slides. I've tried to find a way to create a paintbrush effect, to underline, accentuate, add some color and the handwritten markers were just the things. Very easy to use, easy to size, change the color. It was an affordable, perfect solution and I'm happy to recommend it.
Anonymous, US
The crisp, clean look of the graphics, and the fact that it allowed me to easily edit and change the colors to match the template was my main reason for purchasing them.
Brandie Jenkins, E-learning Developer, USA
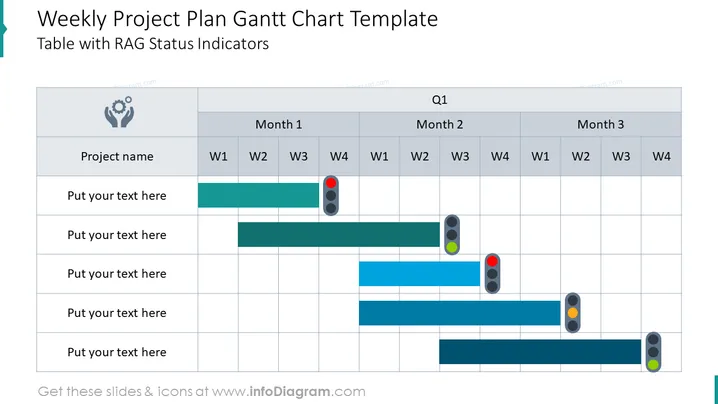
##Weekly Project Plan Gantt Chart Table With RAG Status Indicators Diagram
Creative Gantt chart slide for clear project status indication. Use it for presenting 5 different projects against the yearly calendar table divided into quarters and weeks. Edit RAG status indicators changing the light from red through yellow to green to give a clear message about the development stage. Learn more about the Gannt chart on Wikipedia. Learn more about the Gannt chart on Wikipedia.
##What Does This Weekly Project Plan Gantt Chart Table With RAG Status Indicators Diagram Include?
This Weekly Project Plan Gantt Chart Table With RAG Status Indicators Diagram is a part of our Gantt Chart Graphics for Project Planning PPT Template.


