Your graphics add a nice touch to my presentations and I recently used them for one of my all-hands meetings. Your toolbox adds professionalism to my slides. Instead of using standard clipart.
Claude Jones, Director of Engineer, @Walmartlabs, USA
Your graphics add a nice touch to my presentations and I recently used them for one of my all-hands meetings. Your toolbox adds professionalism to my slides. Instead of using standard clipart.
Claude Jones, Director of Engineer, @Walmartlabs, USA
I needed a fresh look at some of my slides. I've tried to find a way to create a paintbrush effect, to underline, accentuate, add some color and the handwritten markers were just the things. Very easy to use, easy to size, change the color. It was an affordable, perfect solution and I'm happy to recommend it.
Anonymous, US
The crisp, clean look of the graphics, and the fact that it allowed me to easily edit and change the colors to match the template was my main reason for purchasing them.
Brandie Jenkins, E-learning Developer, USA
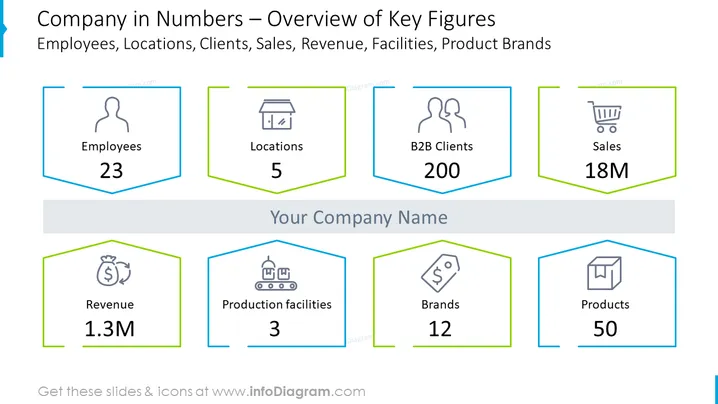
This PowerPoint slide provides an overview of a company's key figures, focusing on quantitative metrics such as the number of employees, locations, B2B clients, sales, revenue, production facilities, brands, and products. The slide presents the figures in a clear and concise manner, with the number of employees (23), locations (5), and B2B clients (200) highlighted to convey the company's human resources, geographic reach, and customer base. The sales figure is listed at 18 million, signifying financial performance. The revenue is stated as 1.3 million, providing a glimpse into the financial health. Production facilities are noted as three, indicating the company's operational capacity, while the number of brands (12) and products (50) reflects the company's offerings.
The slide has a clean and professional appearance, with a well-structured layout that effectively draws attention to the key figures. The use of icons alongside the data provides visual cues that help with quick identification of the corresponding metrics.


