Your graphics add a nice touch to my presentations and I recently used them for one of my all-hands meetings. Your toolbox adds professionalism to my slides. Instead of using standard clipart.
Claude Jones, Director of Engineer, @Walmartlabs, USA
Your graphics add a nice touch to my presentations and I recently used them for one of my all-hands meetings. Your toolbox adds professionalism to my slides. Instead of using standard clipart.
Claude Jones, Director of Engineer, @Walmartlabs, USA
I needed a fresh look at some of my slides. I've tried to find a way to create a paintbrush effect, to underline, accentuate, add some color and the handwritten markers were just the things. Very easy to use, easy to size, change the color. It was an affordable, perfect solution and I'm happy to recommend it.
Anonymous, US
The crisp, clean look of the graphics, and the fact that it allowed me to easily edit and change the colors to match the template was my main reason for purchasing them.
Brandie Jenkins, E-learning Developer, USA
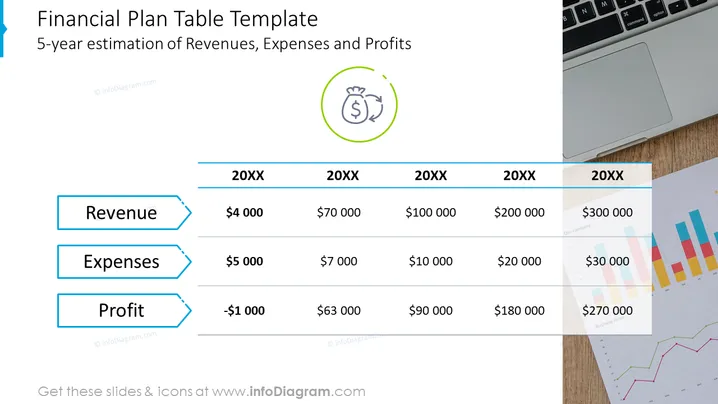
The slide is titled "Financial Plan Table Template" and provides a 5-year estimation of Revenues, Expenses, and Profits. The table is arranged with years labeled as "20XX" across the top, and values under Revenue, Expenses, and Profit for each year. Revenue ranges from $4,000 to $300,000, Expenses from $5,000 to $30,000, and Profit starts at a loss of $1,000, eventually growing to a gain of $270,000. Each category is explained as follows: Revenue indicates the total income, Expenses denote the money spent or costs, and Profit represents the financial gain after subtracting expenses from revenue.
The slide looks visually balanced with a combination of textual information and understated graphics on the edges. The use of color and icons efficiently conveys the financial concept being presented.


