Your graphics add a nice touch to my presentations and I recently used them for one of my all-hands meetings. Your toolbox adds professionalism to my slides. Instead of using standard clipart.
Claude Jones, Director of Engineer, @Walmartlabs, USA
Your graphics add a nice touch to my presentations and I recently used them for one of my all-hands meetings. Your toolbox adds professionalism to my slides. Instead of using standard clipart.
Claude Jones, Director of Engineer, @Walmartlabs, USA
I needed a fresh look at some of my slides. I've tried to find a way to create a paintbrush effect, to underline, accentuate, add some color and the handwritten markers were just the things. Very easy to use, easy to size, change the color. It was an affordable, perfect solution and I'm happy to recommend it.
Anonymous, US
The crisp, clean look of the graphics, and the fact that it allowed me to easily edit and change the colors to match the template was my main reason for purchasing them.
Brandie Jenkins, E-learning Developer, USA
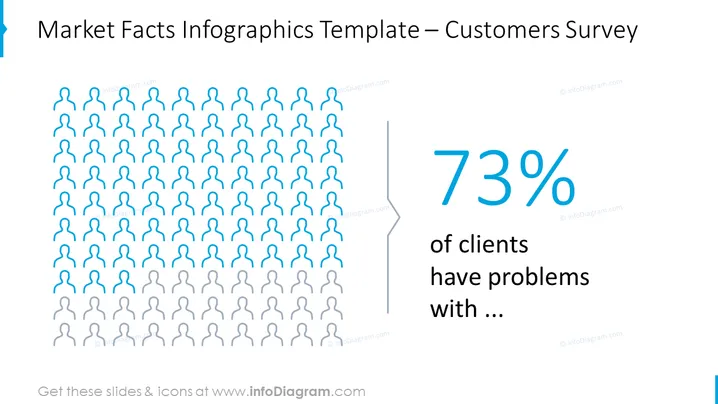
This slide is titled "Market Facts Infographics Template – Customers Survey" and it displays the results of a customer survey in a visual format. A graphic representation shows a large group of stylized human figures, with a significant portion highlighted to reflect a percentage. The slide indicates that 73% of clients have problems, but the specific issues are not detailed, suggesting that this is a summarized view of a broader survey finding.
The slide has a minimalistic and clean design that clearly communicates the magnitude of a problem among a surveyed population through visual contrast and a large, eye-catching percentage figure.


