Your graphics add a nice touch to my presentations and I recently used them for one of my all-hands meetings. Your toolbox adds professionalism to my slides. Instead of using standard clipart.
Claude Jones, Director of Engineer, @Walmartlabs, USA
Your graphics add a nice touch to my presentations and I recently used them for one of my all-hands meetings. Your toolbox adds professionalism to my slides. Instead of using standard clipart.
Claude Jones, Director of Engineer, @Walmartlabs, USA
I needed a fresh look at some of my slides. I've tried to find a way to create a paintbrush effect, to underline, accentuate, add some color and the handwritten markers were just the things. Very easy to use, easy to size, change the color. It was an affordable, perfect solution and I'm happy to recommend it.
Anonymous, US
The crisp, clean look of the graphics, and the fact that it allowed me to easily edit and change the colors to match the template was my main reason for purchasing them.
Brandie Jenkins, E-learning Developer, USA
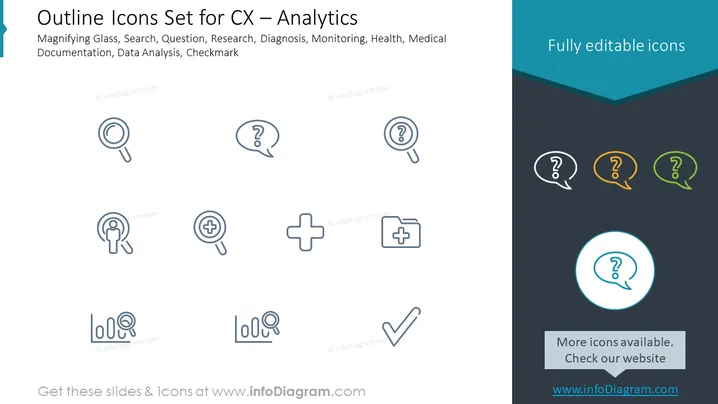
The slide presents a collection of icons relevant to customer experience (CX) analysis and other investigative tasks such as medical or health-related analysis. There are icons depicting a magnifying glass for search or detailed examination tasks, a question mark for inquiry or unknown information, multiple variations of these two symbols combined, a plus symbol within a magnifying glass suggesting zoom or enhanced scrutiny, a plus symbol inside a square likely representing medical or health aid, a checkmark for confirmation or completion, and bar charts with a magnifying glass to imply data analysis.
The overall look of this slide is simple and professional with a clear emphasis on the icons displayed. The use of color is minimal but effectively draws attention to specific icons.


