Your graphics add a nice touch to my presentations and I recently used them for one of my all-hands meetings. Your toolbox adds professionalism to my slides. Instead of using standard clipart.
Claude Jones, Director of Engineer, @Walmartlabs, USA
Your graphics add a nice touch to my presentations and I recently used them for one of my all-hands meetings. Your toolbox adds professionalism to my slides. Instead of using standard clipart.
Claude Jones, Director of Engineer, @Walmartlabs, USA
I needed a fresh look at some of my slides. I've tried to find a way to create a paintbrush effect, to underline, accentuate, add some color and the handwritten markers were just the things. Very easy to use, easy to size, change the color. It was an affordable, perfect solution and I'm happy to recommend it.
Anonymous, US
The crisp, clean look of the graphics, and the fact that it allowed me to easily edit and change the colors to match the template was my main reason for purchasing them.
Brandie Jenkins, E-learning Developer, USA
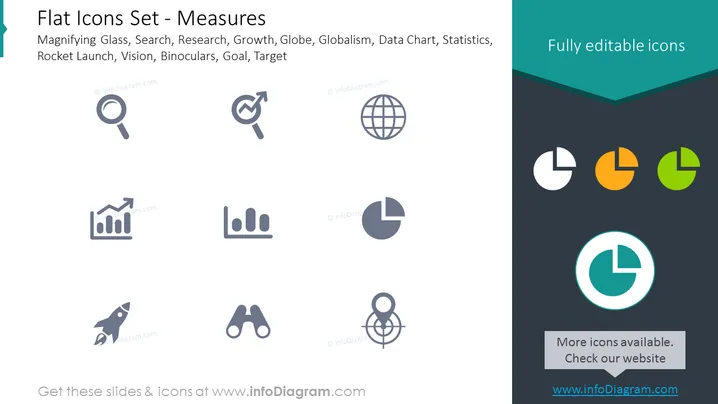
The PowerPoint slide titled "Flat Icons Set - Measures" showcases a collection of icons representing various measurement tools and concepts, such as Magnifying Glass (implying search or scrutiny), Search, Research (the systematic investigation into study materials and sources), Growth (an increase, expansion, or development), Globe (representing globalism or worldwide scope), Globalism, Data Chart (visual representation of data), Statistics (a branch of mathematics dealing with data collection, analysis, interpretation, and presentation), Rocket Launch (symbolizing rapid ascent or startup), Vision (the ability to think about or plan the future with imagination or wisdom), Binoculars (narrowing focus or detailed observation), Goal, and Target (the intended result).
The slide has a clean, professional look with a symmetrical and balanced layout. The chosen color scheme is limited, ensuring that the icons stand out against both the light and dark backgrounds.


