Your graphics add a nice touch to my presentations and I recently used them for one of my all-hands meetings. Your toolbox adds professionalism to my slides. Instead of using standard clipart.
Claude Jones, Director of Engineer, @Walmartlabs, USA
Your graphics add a nice touch to my presentations and I recently used them for one of my all-hands meetings. Your toolbox adds professionalism to my slides. Instead of using standard clipart.
Claude Jones, Director of Engineer, @Walmartlabs, USA
I needed a fresh look at some of my slides. I've tried to find a way to create a paintbrush effect, to underline, accentuate, add some color and the handwritten markers were just the things. Very easy to use, easy to size, change the color. It was an affordable, perfect solution and I'm happy to recommend it.
Anonymous, US
The crisp, clean look of the graphics, and the fact that it allowed me to easily edit and change the colors to match the template was my main reason for purchasing them.
Brandie Jenkins, E-learning Developer, USA
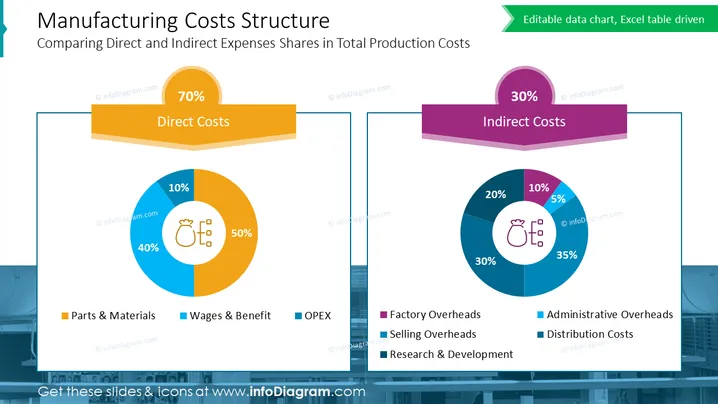
The slide titled "Manufacturing Costs Structure" compares Direct and Indirect Expenses Shares in Total Production Costs. On the left, Direct Costs are presented as 70% of total costs with a breakdown of 50% Parts & Materials, 40% Wages & Benefit, and 10% OPEX, indicating the tangible costs of production like materials and labor. On the right, Indirect Costs account for 30% with a breakdown of 35% Administrative Overheads, 30% Factory Overheads, 20% Selling Overheads, and 10% Research & Development, representing the costs that are not directly tied to the manufacturing process, like management and sales efforts.
The slide has a clean and professional design with a balance between graphical elements and information. The contrasting colors and clear labels make it visually appealing and easy to understand at a glance.


