Your graphics add a nice touch to my presentations and I recently used them for one of my all-hands meetings. Your toolbox adds professionalism to my slides. Instead of using standard clipart.
Claude Jones, Director of Engineer, @Walmartlabs, USA
Your graphics add a nice touch to my presentations and I recently used them for one of my all-hands meetings. Your toolbox adds professionalism to my slides. Instead of using standard clipart.
Claude Jones, Director of Engineer, @Walmartlabs, USA
I needed a fresh look at some of my slides. I've tried to find a way to create a paintbrush effect, to underline, accentuate, add some color and the handwritten markers were just the things. Very easy to use, easy to size, change the color. It was an affordable, perfect solution and I'm happy to recommend it.
Anonymous, US
The crisp, clean look of the graphics, and the fact that it allowed me to easily edit and change the colors to match the template was my main reason for purchasing them.
Brandie Jenkins, E-learning Developer, USA
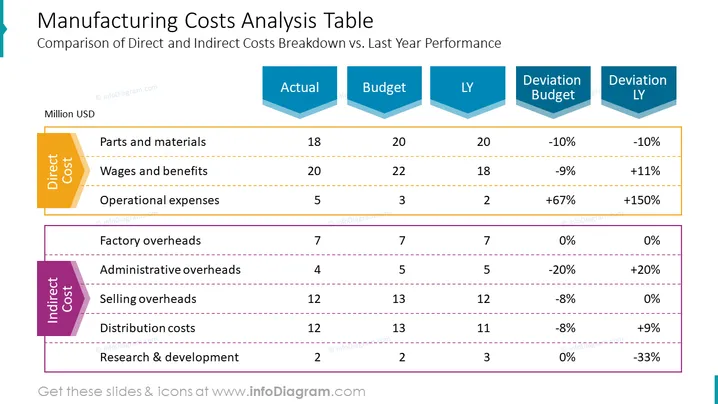
The slide is dedicated to the comparison of direct and indirect manufacturing costs against the actual, budget, and last year (LY) performance. Direct costs include parts and materials, wages and benefits, and operational expenses, each associated with specific values and their deviations from budget and LY. Indirect costs are comprised of factory, administrative, and selling overheads, along with distribution costs and research & development, also with their corresponding values and deviations. The slide breaks down these costs to showcase where financial variances occur and to what extent relative to the budgeted amounts and previous year's figures.
The slide maintains a clean and structured layout with contrasting colors for differentiation. It uses color-coded sections and clear fonts to present complex financial data in a digestible format.


