Your graphics add a nice touch to my presentations and I recently used them for one of my all-hands meetings. Your toolbox adds professionalism to my slides. Instead of using standard clipart.
Claude Jones, Director of Engineer, @Walmartlabs, USA
Your graphics add a nice touch to my presentations and I recently used them for one of my all-hands meetings. Your toolbox adds professionalism to my slides. Instead of using standard clipart.
Claude Jones, Director of Engineer, @Walmartlabs, USA
I needed a fresh look at some of my slides. I've tried to find a way to create a paintbrush effect, to underline, accentuate, add some color and the handwritten markers were just the things. Very easy to use, easy to size, change the color. It was an affordable, perfect solution and I'm happy to recommend it.
Anonymous, US
The crisp, clean look of the graphics, and the fact that it allowed me to easily edit and change the colors to match the template was my main reason for purchasing them.
Brandie Jenkins, E-learning Developer, USA
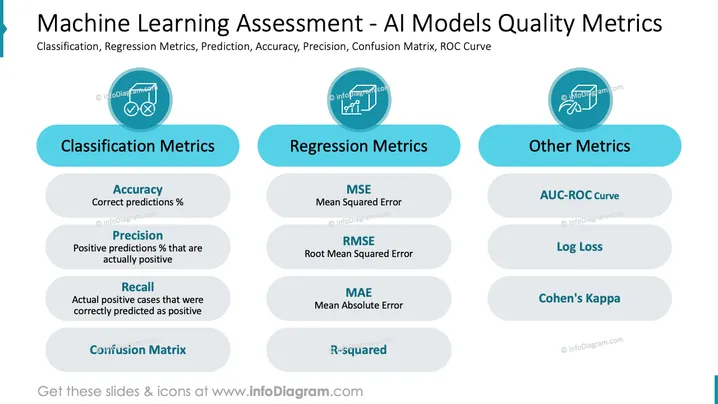
The PowerPoint slide is titled "Machine Learning Assessment - AI Models Quality Metrics" and is focused on various metrics used to evaluate the quality of machine learning models, categorized into Classification Metrics, Regression Metrics, and Other Metrics. Classification Metrics include Accuracy (correct predictions percentage), Precision (percentage of positive predictions that are actually positive), Recall (actual positive cases that were correctly predicted), and Confusion Matrix (a table used to describe the performance of a classification model). Regression Metrics cover MSE (Mean Squared Error), RMSE (Root Mean Squared Error), MAE (Mean Absolute Error), and R-squared (a statistical measure of how close the data are to the fitted regression line). Other Metrics mentioned are AUC-ROC Curve (Area Under the Receiver Operating Characteristic Curve—a performance measurement for classification problems), Log Loss (a performance metric for evaluating the predictions of probabilities of membership to the given classes), and Cohen's Kappa (a statistic that measures inter-annotator agreement).
The overall look is clean and professional, using color and shape effectively to distinguish between different categories and metrics. The visuals are simple and conceptual rather than literal, helping to relay abstract concepts in a visually hierarchical manner.


