Your graphics add a nice touch to my presentations and I recently used them for one of my all-hands meetings. Your toolbox adds professionalism to my slides. Instead of using standard clipart.
Claude Jones, Director of Engineer, @Walmartlabs, USA
Your graphics add a nice touch to my presentations and I recently used them for one of my all-hands meetings. Your toolbox adds professionalism to my slides. Instead of using standard clipart.
Claude Jones, Director of Engineer, @Walmartlabs, USA
I needed a fresh look at some of my slides. I've tried to find a way to create a paintbrush effect, to underline, accentuate, add some color and the handwritten markers were just the things. Very easy to use, easy to size, change the color. It was an affordable, perfect solution and I'm happy to recommend it.
Anonymous, US
The crisp, clean look of the graphics, and the fact that it allowed me to easily edit and change the colors to match the template was my main reason for purchasing them.
Brandie Jenkins, E-learning Developer, USA
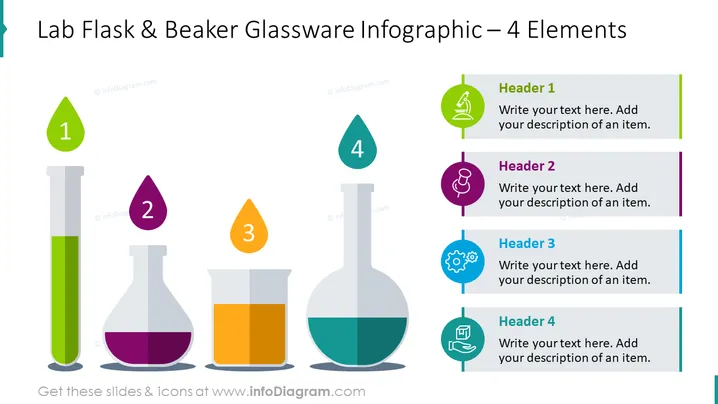
##Lab Flask and Beaker Glassware Infographic for Four Elements Diagram
Use this imaginative slide to present results engagingly. Each flask in this composition contains a different level of colorful substance, which can be used to create a bar chart. Change the order of visuals if needed, add descriptions, and adjust the diagram's colors to match the visual style of your presentation and you are ready to go.
##What Does This Lab Flask and Beaker Glassware Infographic for Four Elements Diagram Include?
This Lab Flask and Beaker Glassware Infographic for Four Elements Diagram is a part of our Chemical Lab Test Tube Graphics PPT Template.


