Your graphics add a nice touch to my presentations and I recently used them for one of my all-hands meetings. Your toolbox adds professionalism to my slides. Instead of using standard clipart.
Claude Jones, Director of Engineer, @Walmartlabs, USA
Your graphics add a nice touch to my presentations and I recently used them for one of my all-hands meetings. Your toolbox adds professionalism to my slides. Instead of using standard clipart.
Claude Jones, Director of Engineer, @Walmartlabs, USA
I needed a fresh look at some of my slides. I've tried to find a way to create a paintbrush effect, to underline, accentuate, add some color and the handwritten markers were just the things. Very easy to use, easy to size, change the color. It was an affordable, perfect solution and I'm happy to recommend it.
Anonymous, US
The crisp, clean look of the graphics, and the fact that it allowed me to easily edit and change the colors to match the template was my main reason for purchasing them.
Brandie Jenkins, E-learning Developer, USA
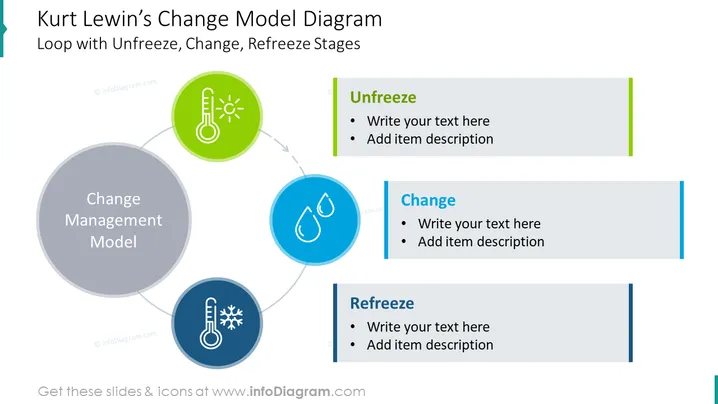
##Slide content: This is an infographic slide showing the 3 stages of the change leadership model invented by Kurt Lewin. These stages are: unfreeze, change, and refreeze. You can use this presentation to explain what type of changes you’d like to make in the workplace. This could be a way of communicating, work norms, or any type of business approach that you think could be improved for efficiency. You can reuse this slide for different projects, by adjusting slightly the elements. All of the graphics are editable, so you can also download them in Google Slides and Keynote, without any quality loss. Click on the picture to see the whole Lewin’s Change Management Model PPT Template for more creative ideas.
##Slide infographic description: Infographic Loop Diagram, Flat Style Outline Icons, Teardrop Icon, High-Temperature Icon, Cold Temperature Icon, Arrow Vector, Text Blocks, Line Vector, Bullet Points, Color Coding


